Monitor performance and risk measures across the entire Nasdaq 100
The Nasdaq 100 Tables Screening dashboard allows you to monitor performance across various lookback windows, such as 30, 60, and 90 trading days. By analyzing the ranked returns, you can quickly identify momentum leaders and laggards within the Nasdaq 100, making it easier to spot potential investment opportunities.
The Sharpe ratio computed in the Nasdaq 100 Tables Screening evaluates the risk-adjusted returns of stocks over multiple trading horizons. A higher Sharpe ratio indicates better risk-adjusted performance, helping investors assess which Nasdaq 100 stocks are delivering returns relative to their volatility.
The RSI-style breadth metric in the Nasdaq 100 Tables Screening measures the percentage of days with positive returns for each stock. This metric helps investors gauge market momentum and overall stock performance, providing insights into potential trends within the Nasdaq 100.
This dashboard provides Nasdaq 100 stock screening tables built from daily price data for every index constituent. It ranks returns across multiple lookback windows (such as 30, 60, 90 and 252 trading days) to compare short- and medium-term performance. It also computes Sharpe ratios over the same horizons to evaluate risk-adjusted returns, and includes an RSI-style breadth metric based on the percentage of days with positive returns. Tables are designed for fast cross-sectional comparison to identify momentum leaders, laggards and changes in risk-adjusted performance. Use it to scan the entire Nasdaq 100 efficiently and export the underlying data for deeper analysis.
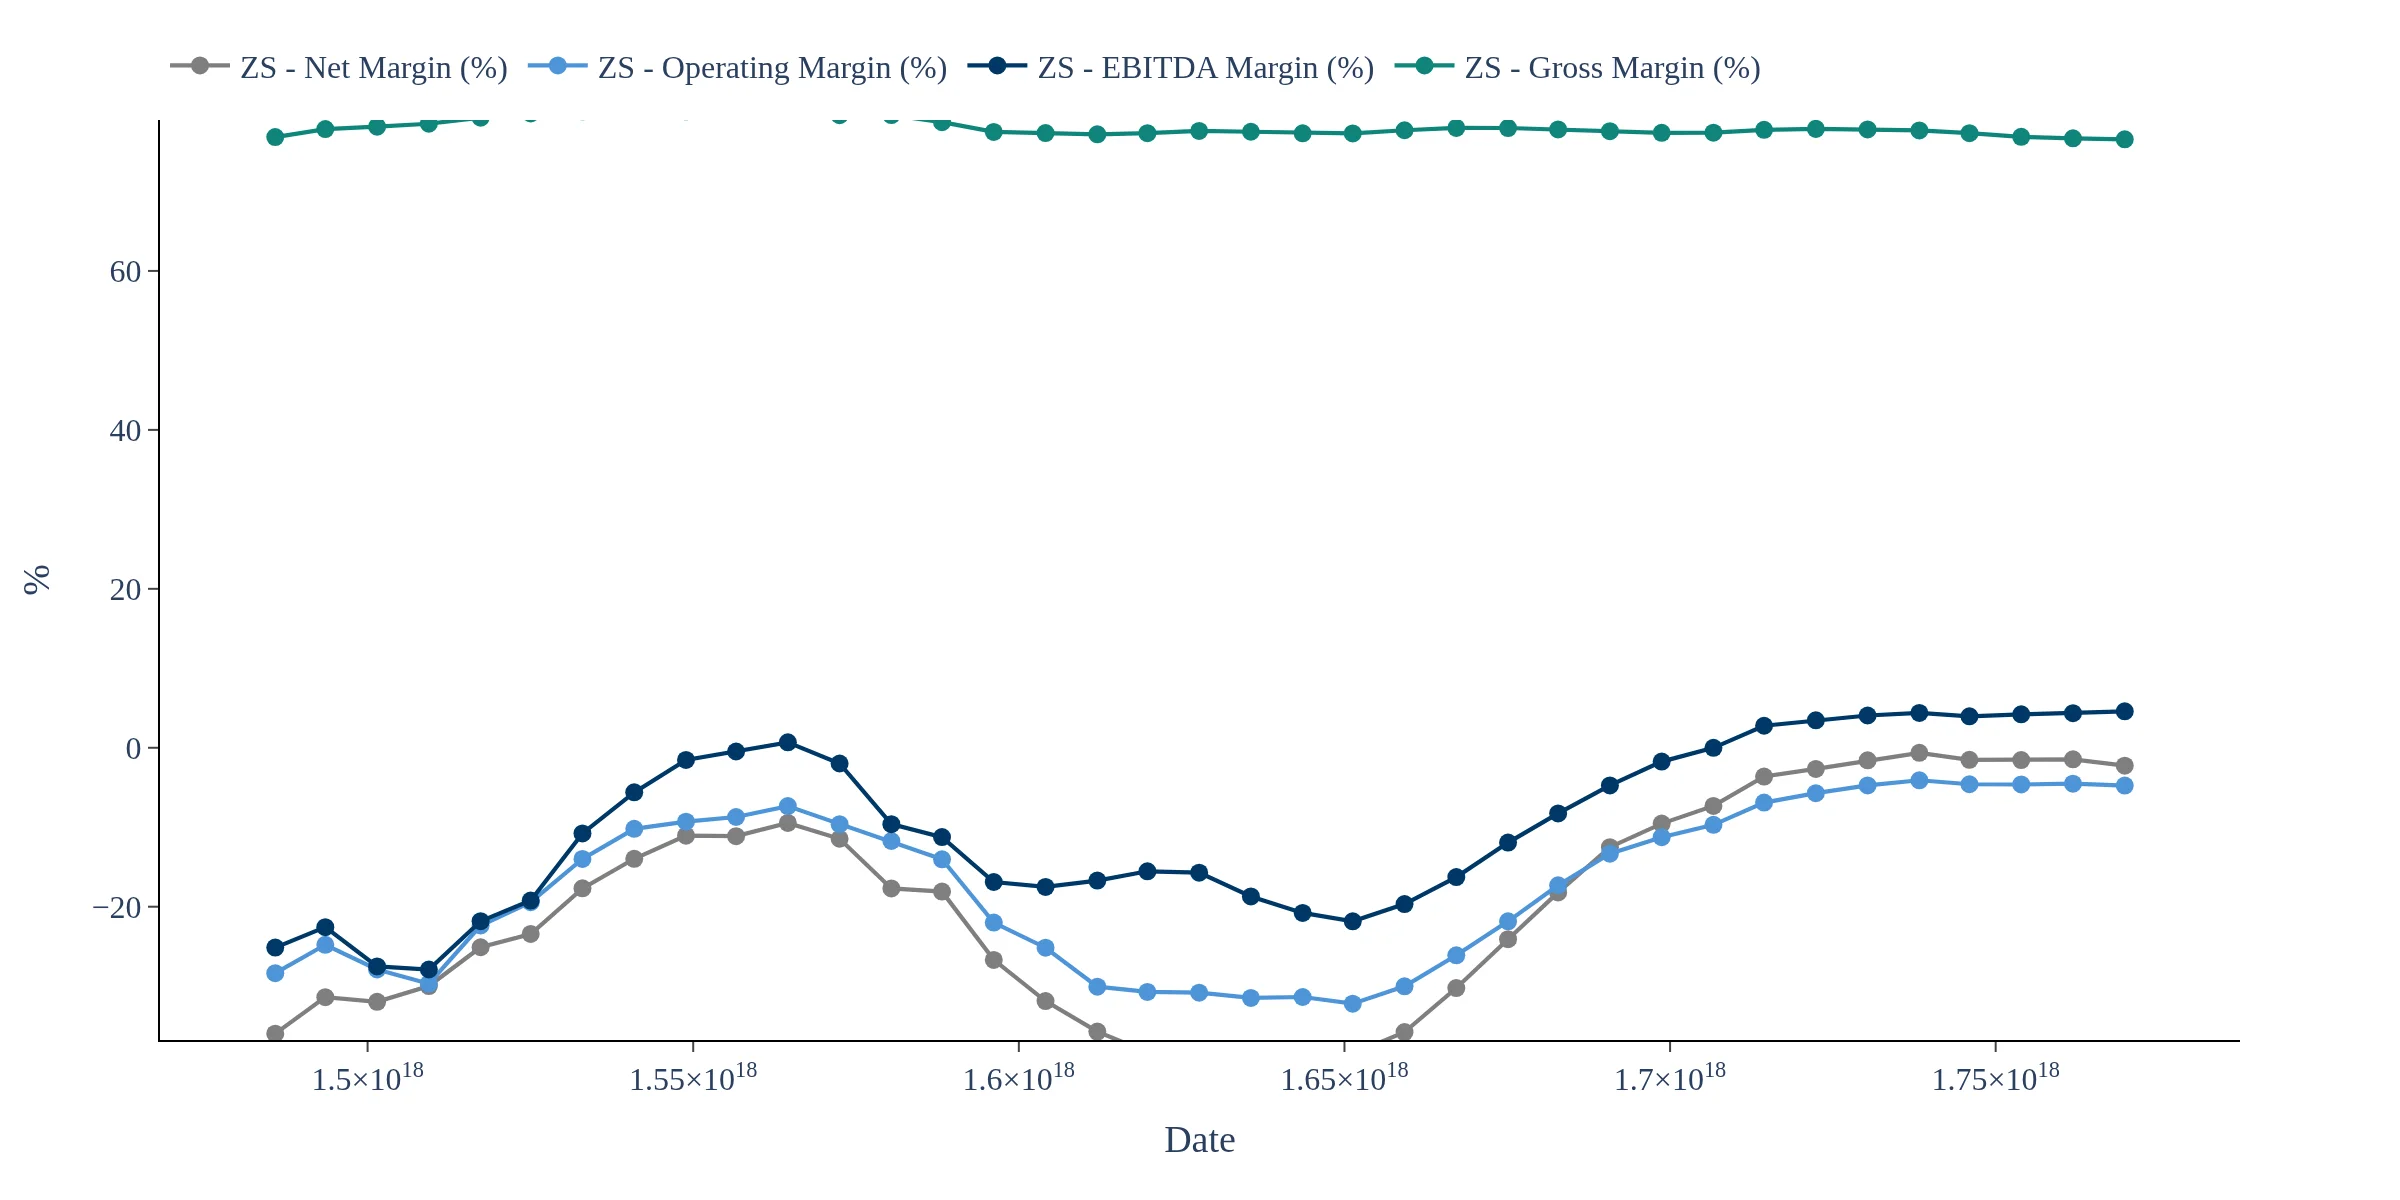
Track quarterly financials for all the stocks in the Nasdaq 100 - Interactive charts with downloadable data
Track price and risk metrics for all the companies inside the S&P 500
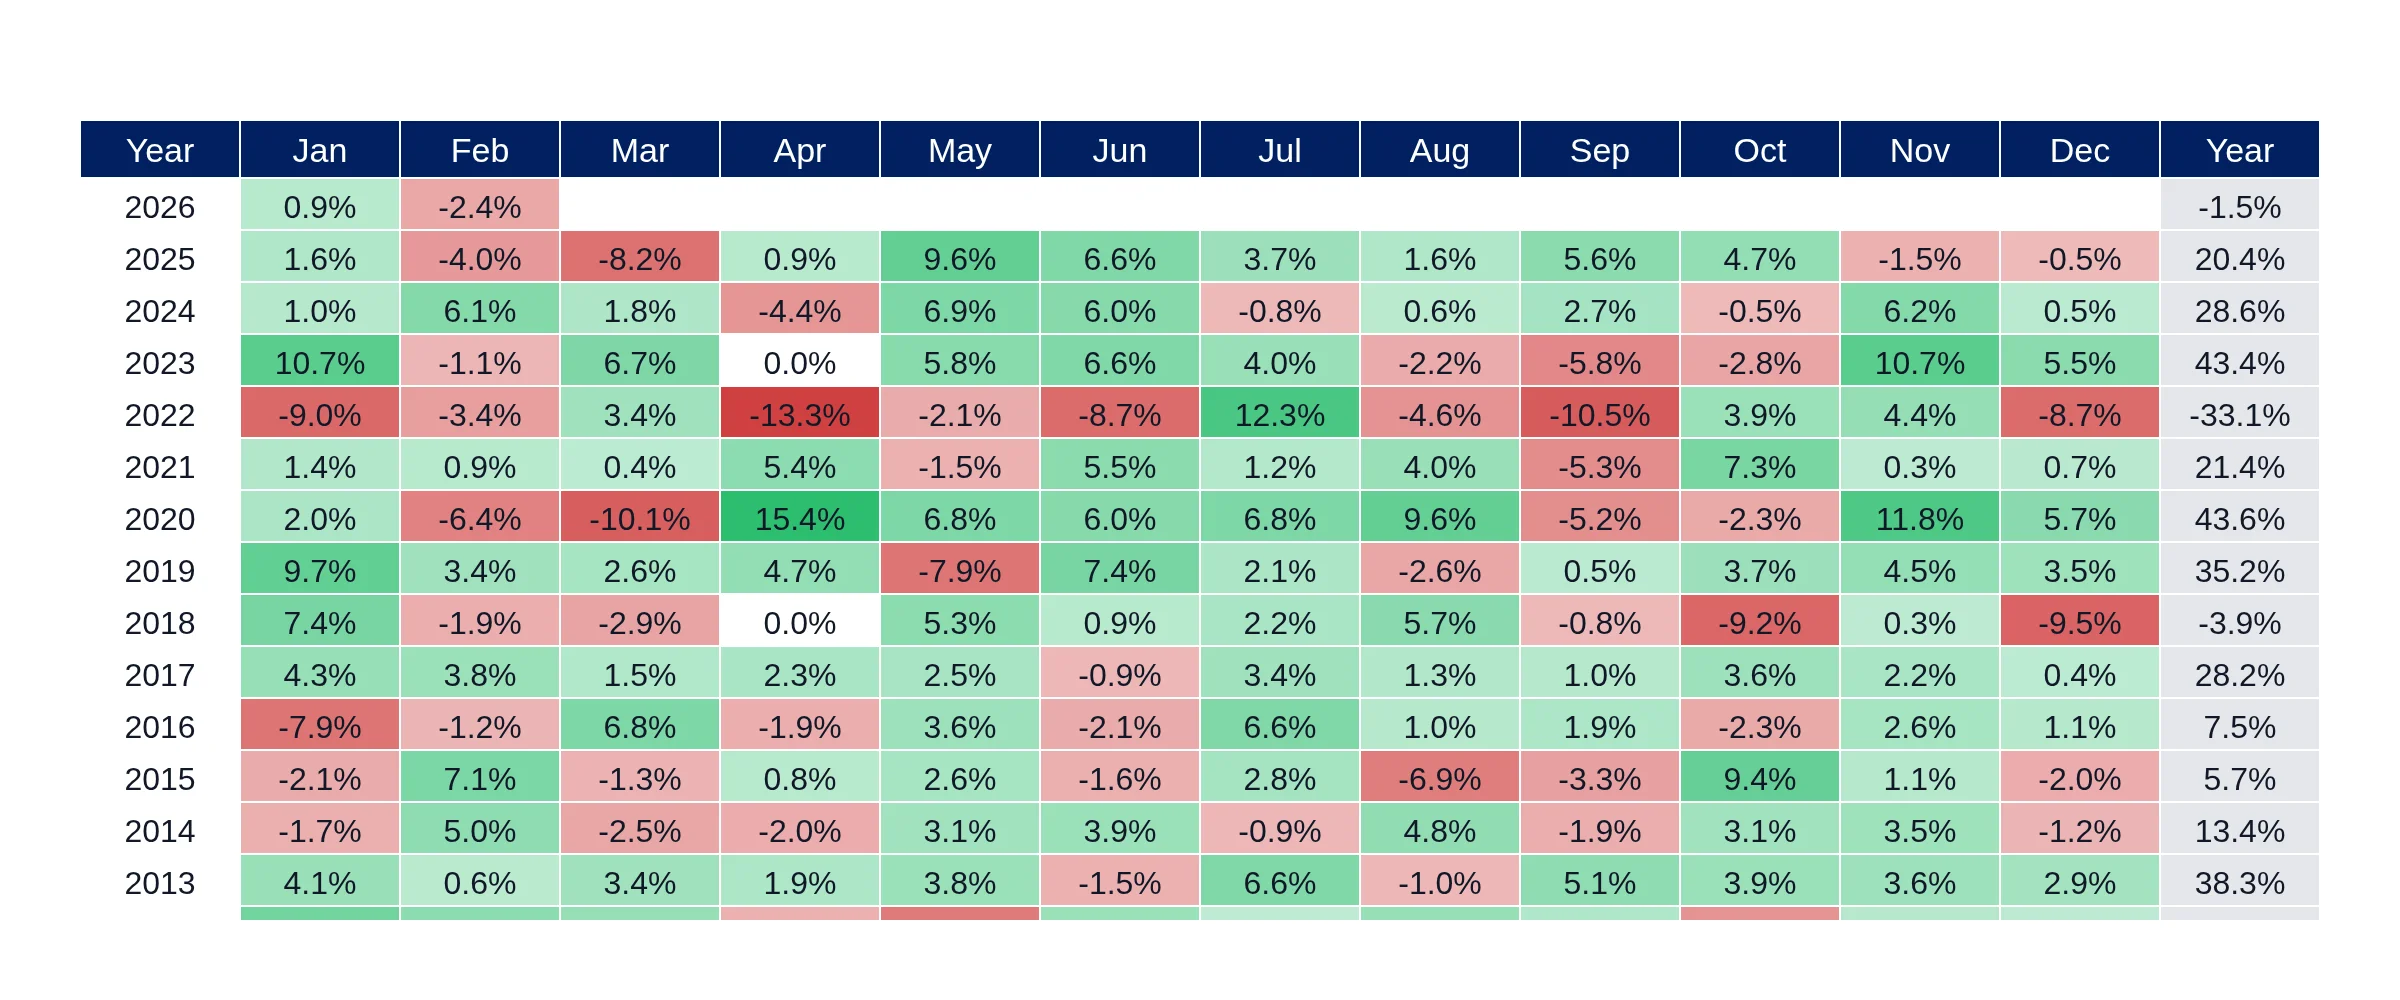
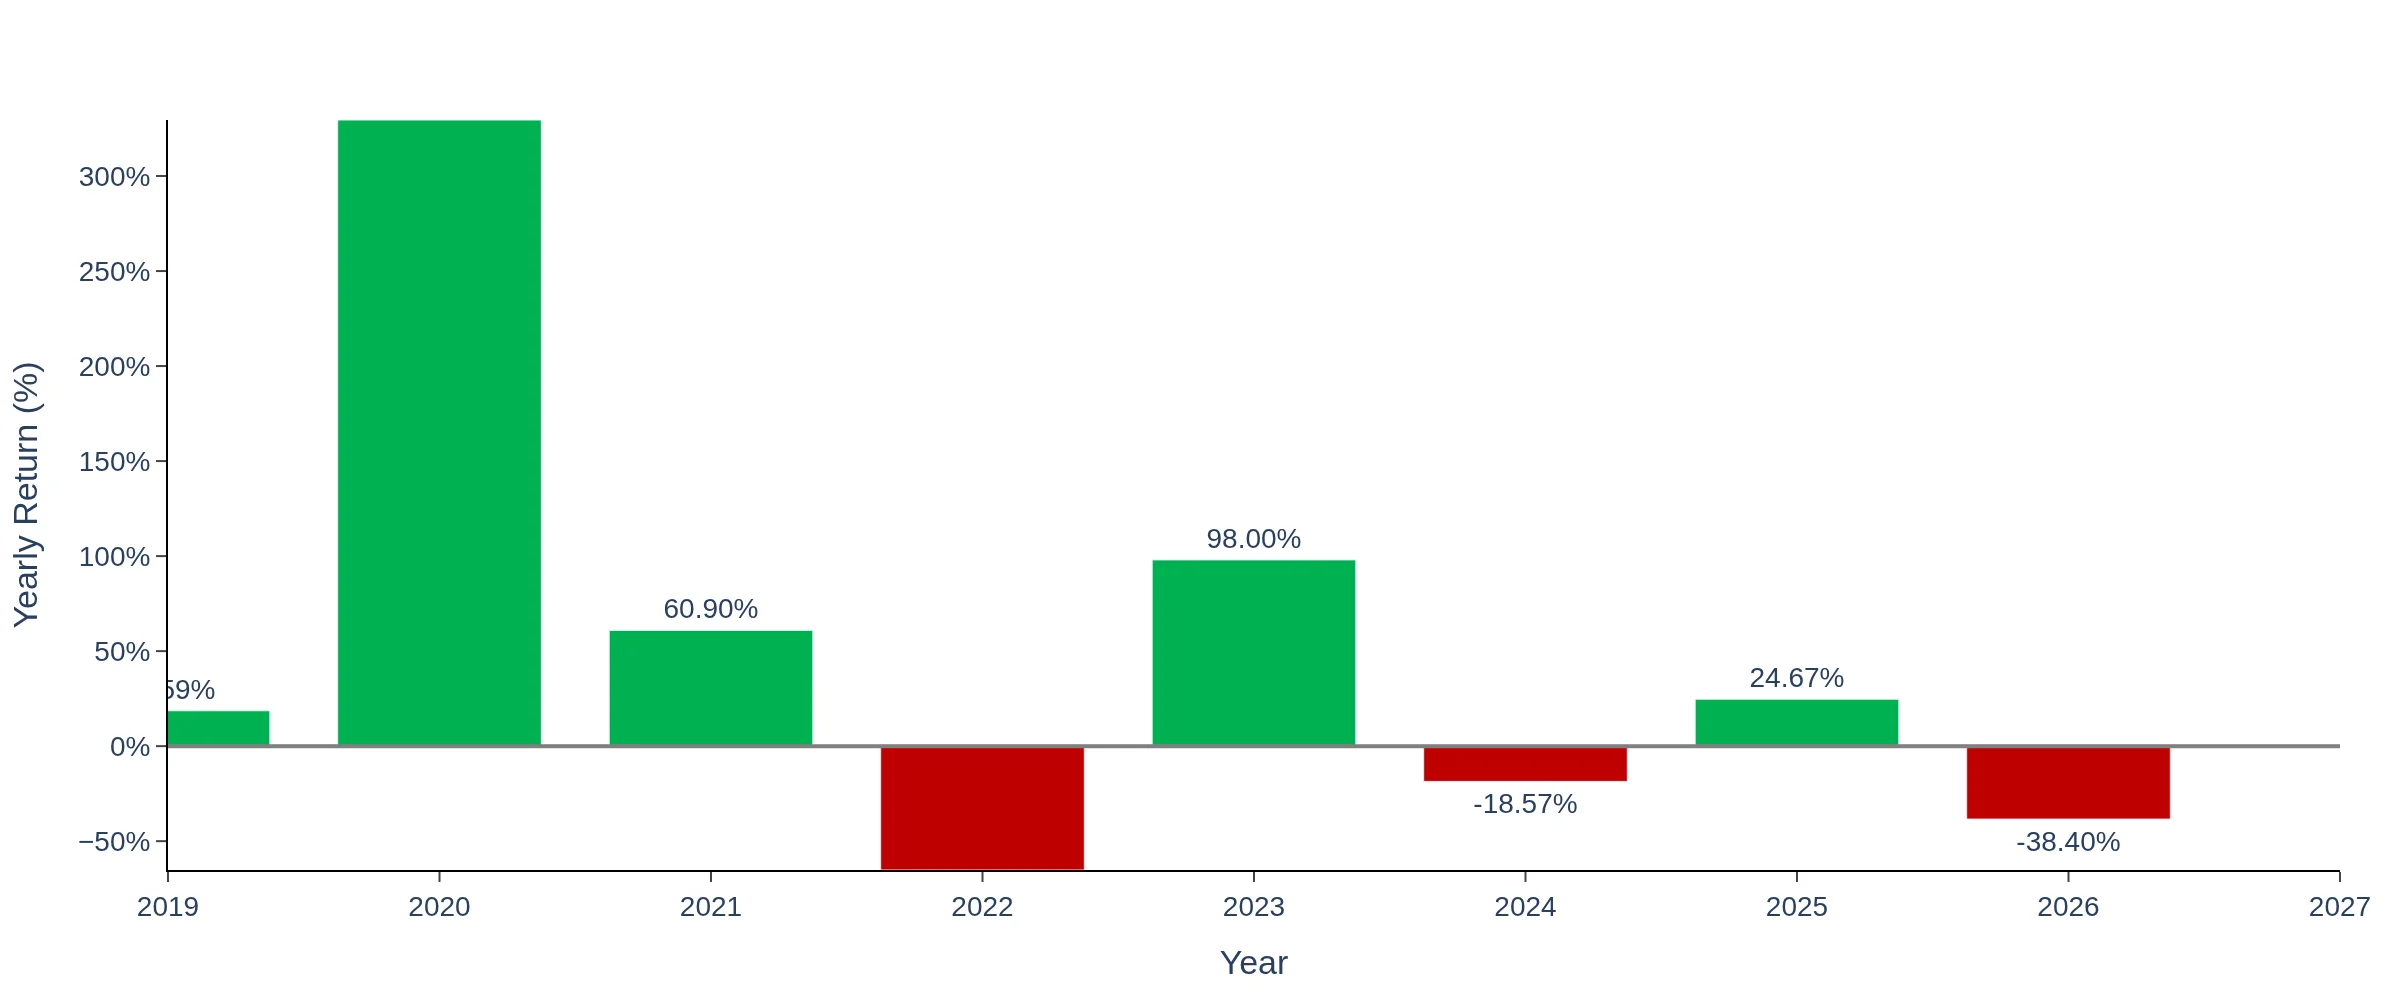
Track Nasdaq Index returns like no other tool does