Track Brazil's mid-month consumer inflation indicator, its underlying momentum and monthly seasonal patterns.
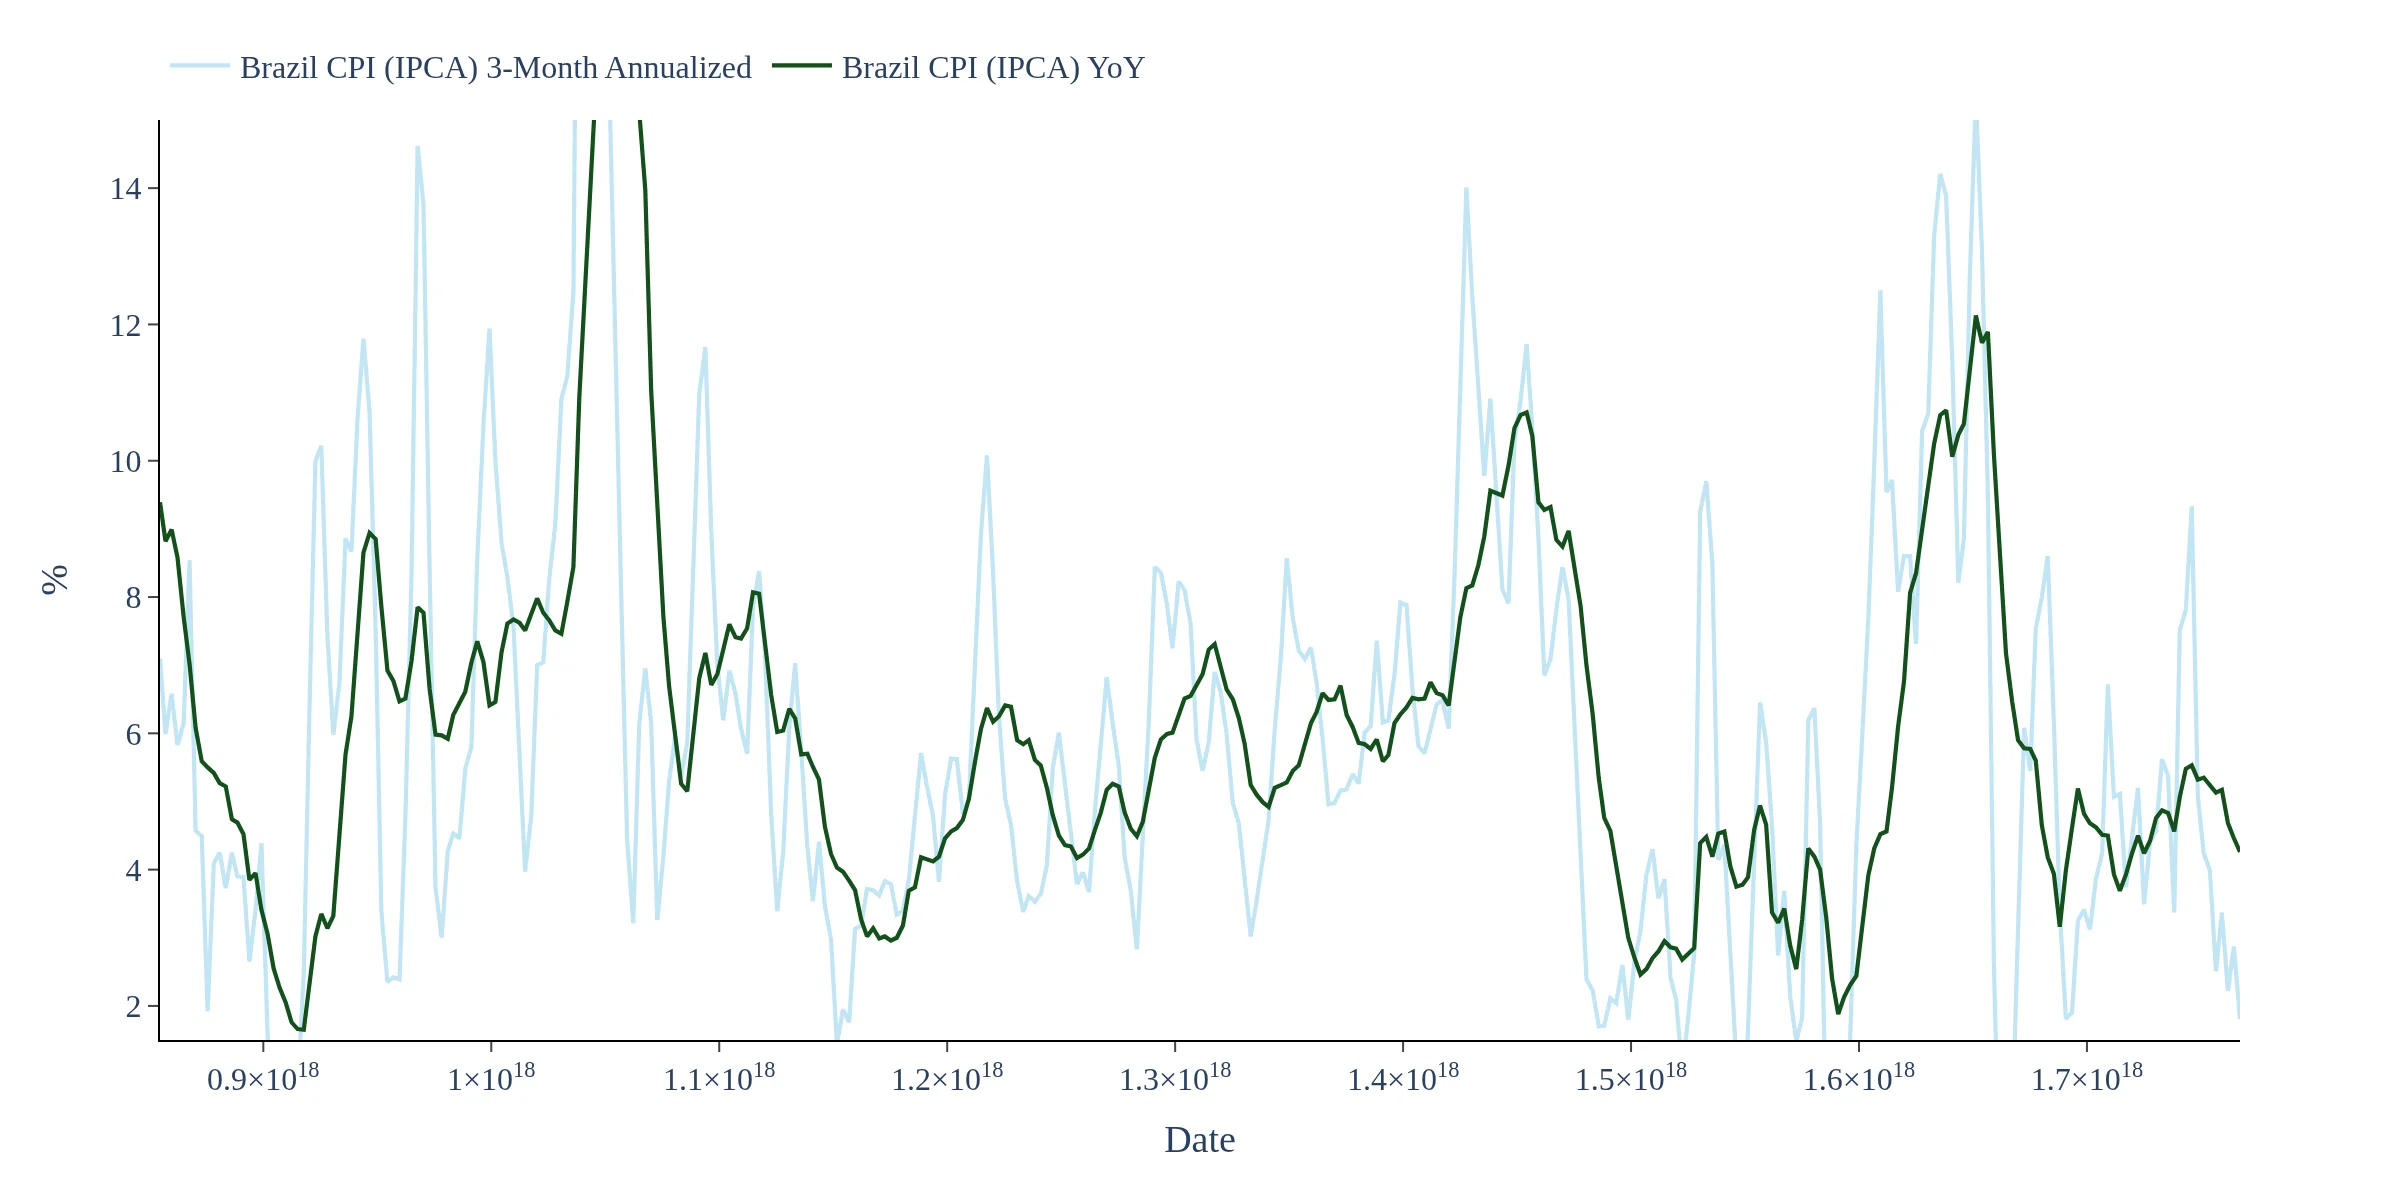
The Brazil IPCA-15 Inflation Dashboard tracks annual inflation by displaying the 12-month percentage change in the seasonally adjusted IPCA-15 index, which is the official mid-month consumer inflation indicator published by IBGE. This allows investors to assess long-term inflation trends in Brazil.
The three-month annualized momentum in the Brazil IPCA-15 Inflation Dashboard indicates the short-term inflation trend by showing the annualized change over the last three months. This metric helps traders and analysts gauge recent inflationary pressures in the Brazilian economy.
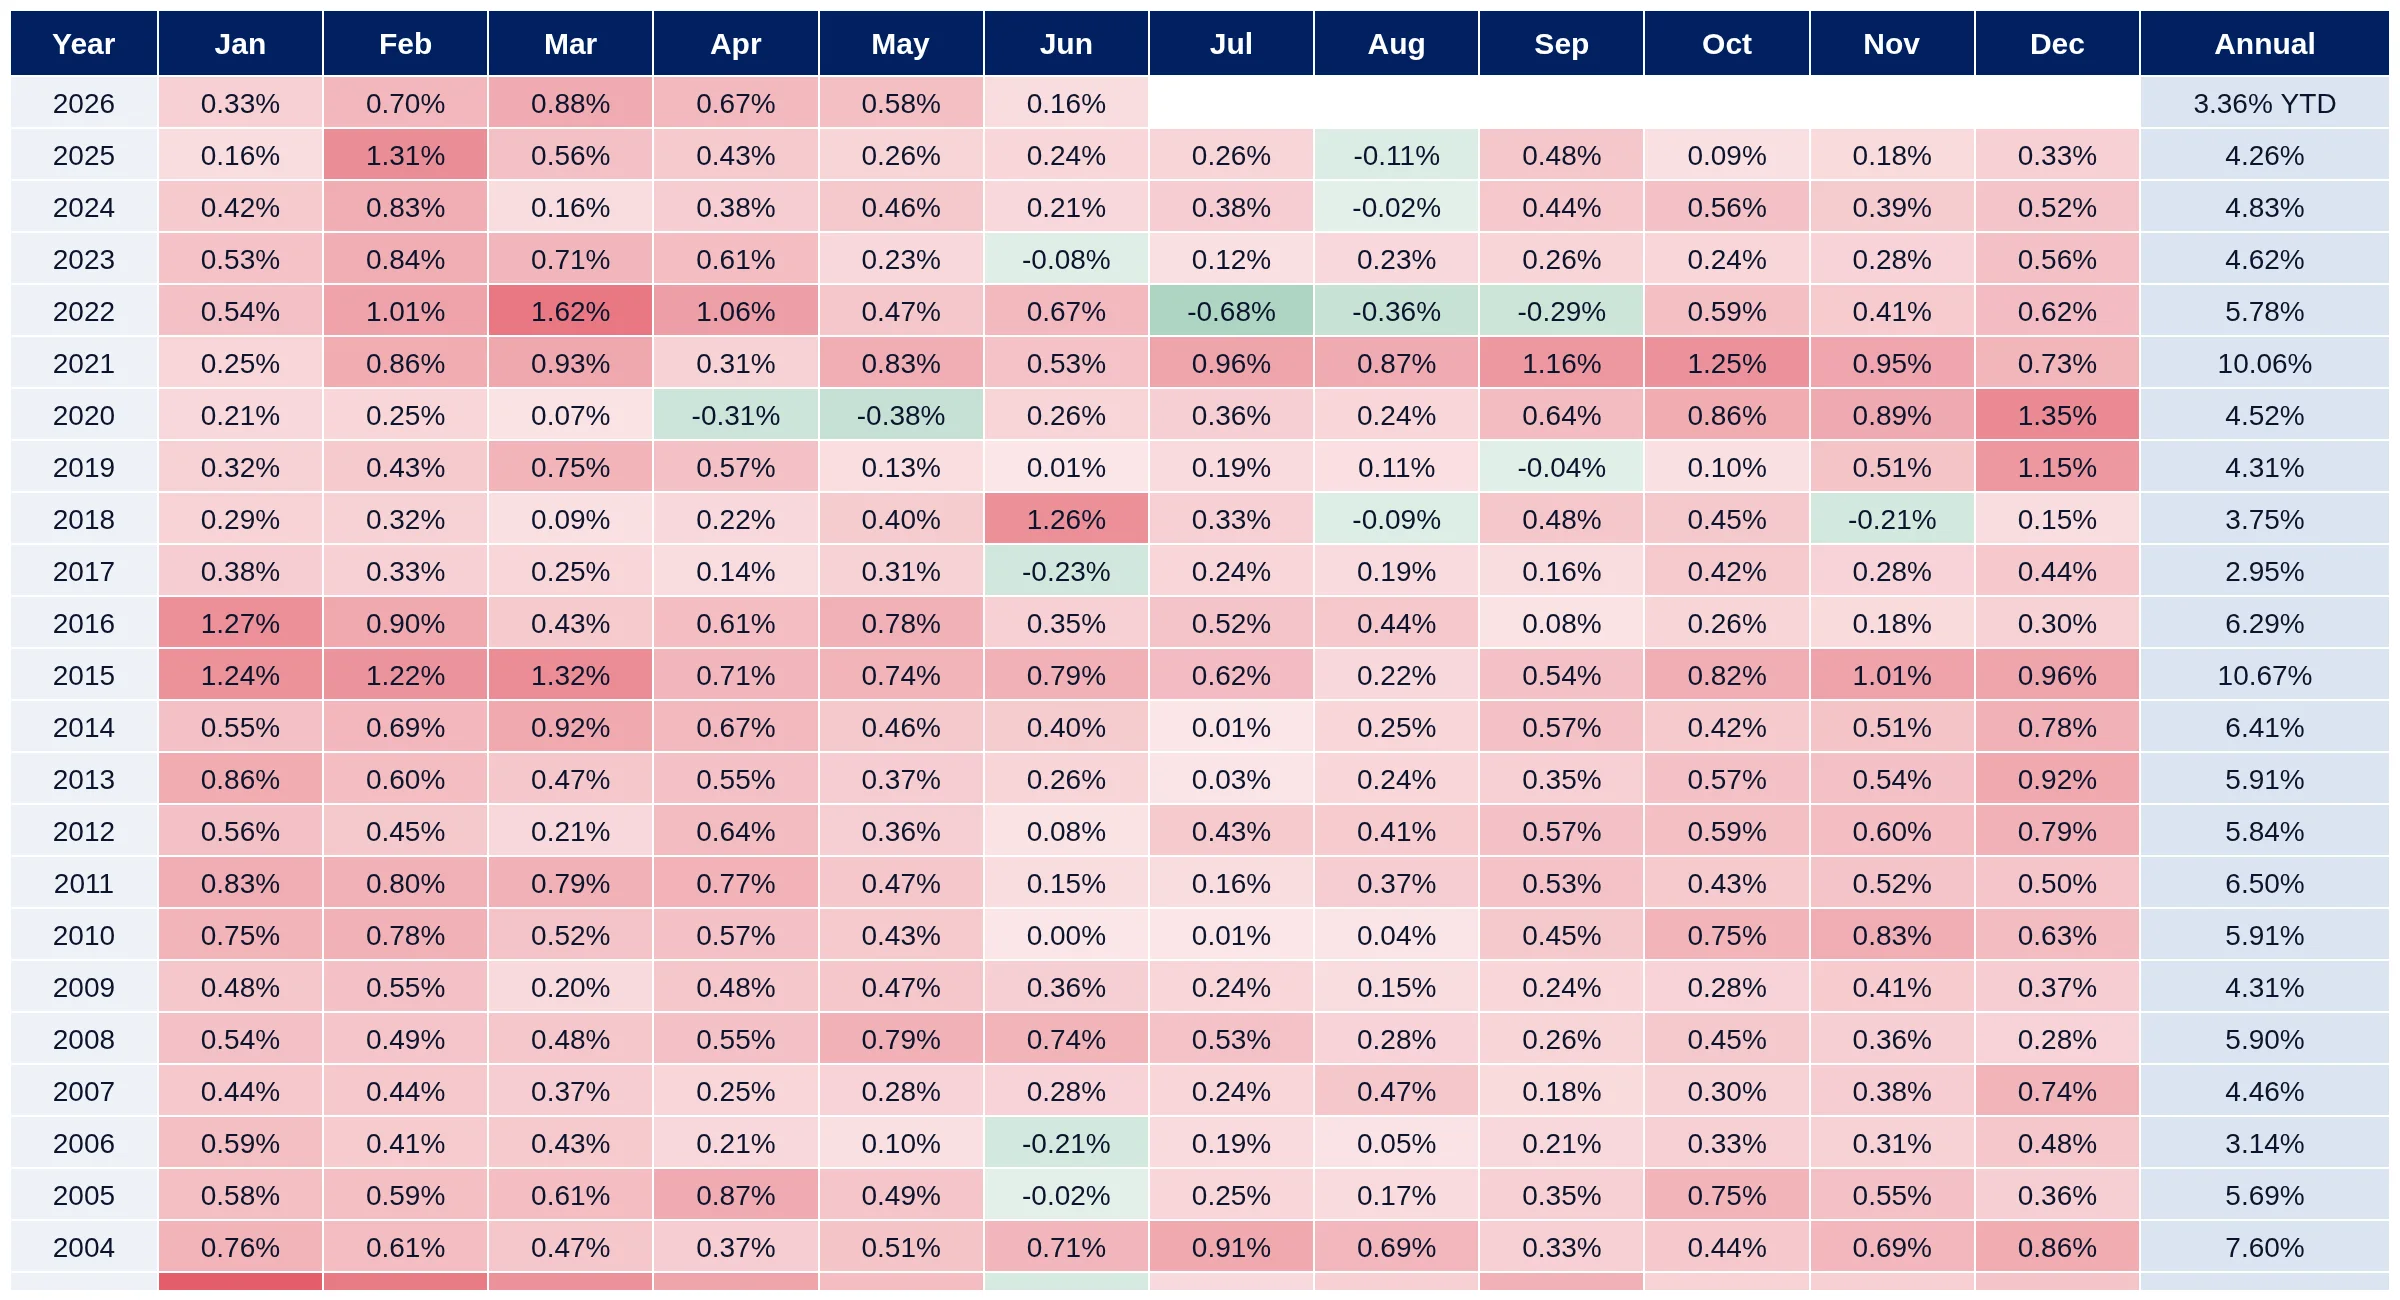
The Brazil IPCA-15 Inflation Dashboard provides a seasonal comparison by displaying not-seasonally-adjusted monthly changes against data from recent calendar years. This feature allows users to identify patterns and fluctuations in monthly inflation rates, aiding in more informed investment decisions.
This dashboard tracks Brazil's IPCA-15, the official mid-month consumer inflation indicator published by IBGE. Annual inflation is the 12-month percentage change in the seasonally adjusted index, while short-term momentum is shown as the annualized change over three months. The seasonal comparison displays not-seasonally-adjusted monthly changes against recent calendar years. The monthly table uses the underlying IPCA-15 index to provide a consistent historical view of monthly and annual inflation changes.