Real performance of Brazil's money market (CDI deflated by IPCA) since 1996. Performance is reported in BRL currency (Brazilian Real).
The dashboard tracks the real performance of Brazil's CDI money market rate after removing the effect of IPCA inflation. It shows the cumulative real return since 1996 and monthly returns tables, allowing investors to understand how much real purchasing power Brazilian cash and money market investments have generated over time.
The real CDI is calculated by dividing the accumulated CDI index (compounding daily CDI rates) by the IPCA price index (Brazil's official consumer price index from IBGE), then normalizing the ratio. This isolates the real return component, stripping out the inflation pass-through embedded in nominal CDI rates.
The dashboard is updated daily on weekdays, reflecting the latest CDI fixings from BCB. IPCA is a monthly release from IBGE, so the inflation adjustment is carried forward using the latest available reading until the next release.
This dashboard tracks the real performance of Brazil's money market using official CDI and IPCA data sourced from the Central Bank of Brazil (BCB) and IBGE. CDI (Certificado de Depósito Interbancário) is Brazil's benchmark overnight interbank rate and closely mirrors the Selic policy rate. The inflation-adjusted series is constructed by dividing the accumulated CDI index by the IPCA price index, then normalizing the result to show real purchasing power gains. Monthly returns tables provide a granular year-by-year breakdown for both the real CDI performance and its underlying components (raw CDI and IPCA). Data is updated daily and covers the full period from 1996 to present, allowing investors to evaluate cycles of real return compression and expansion driven by BCB policy and inflation dynamics.
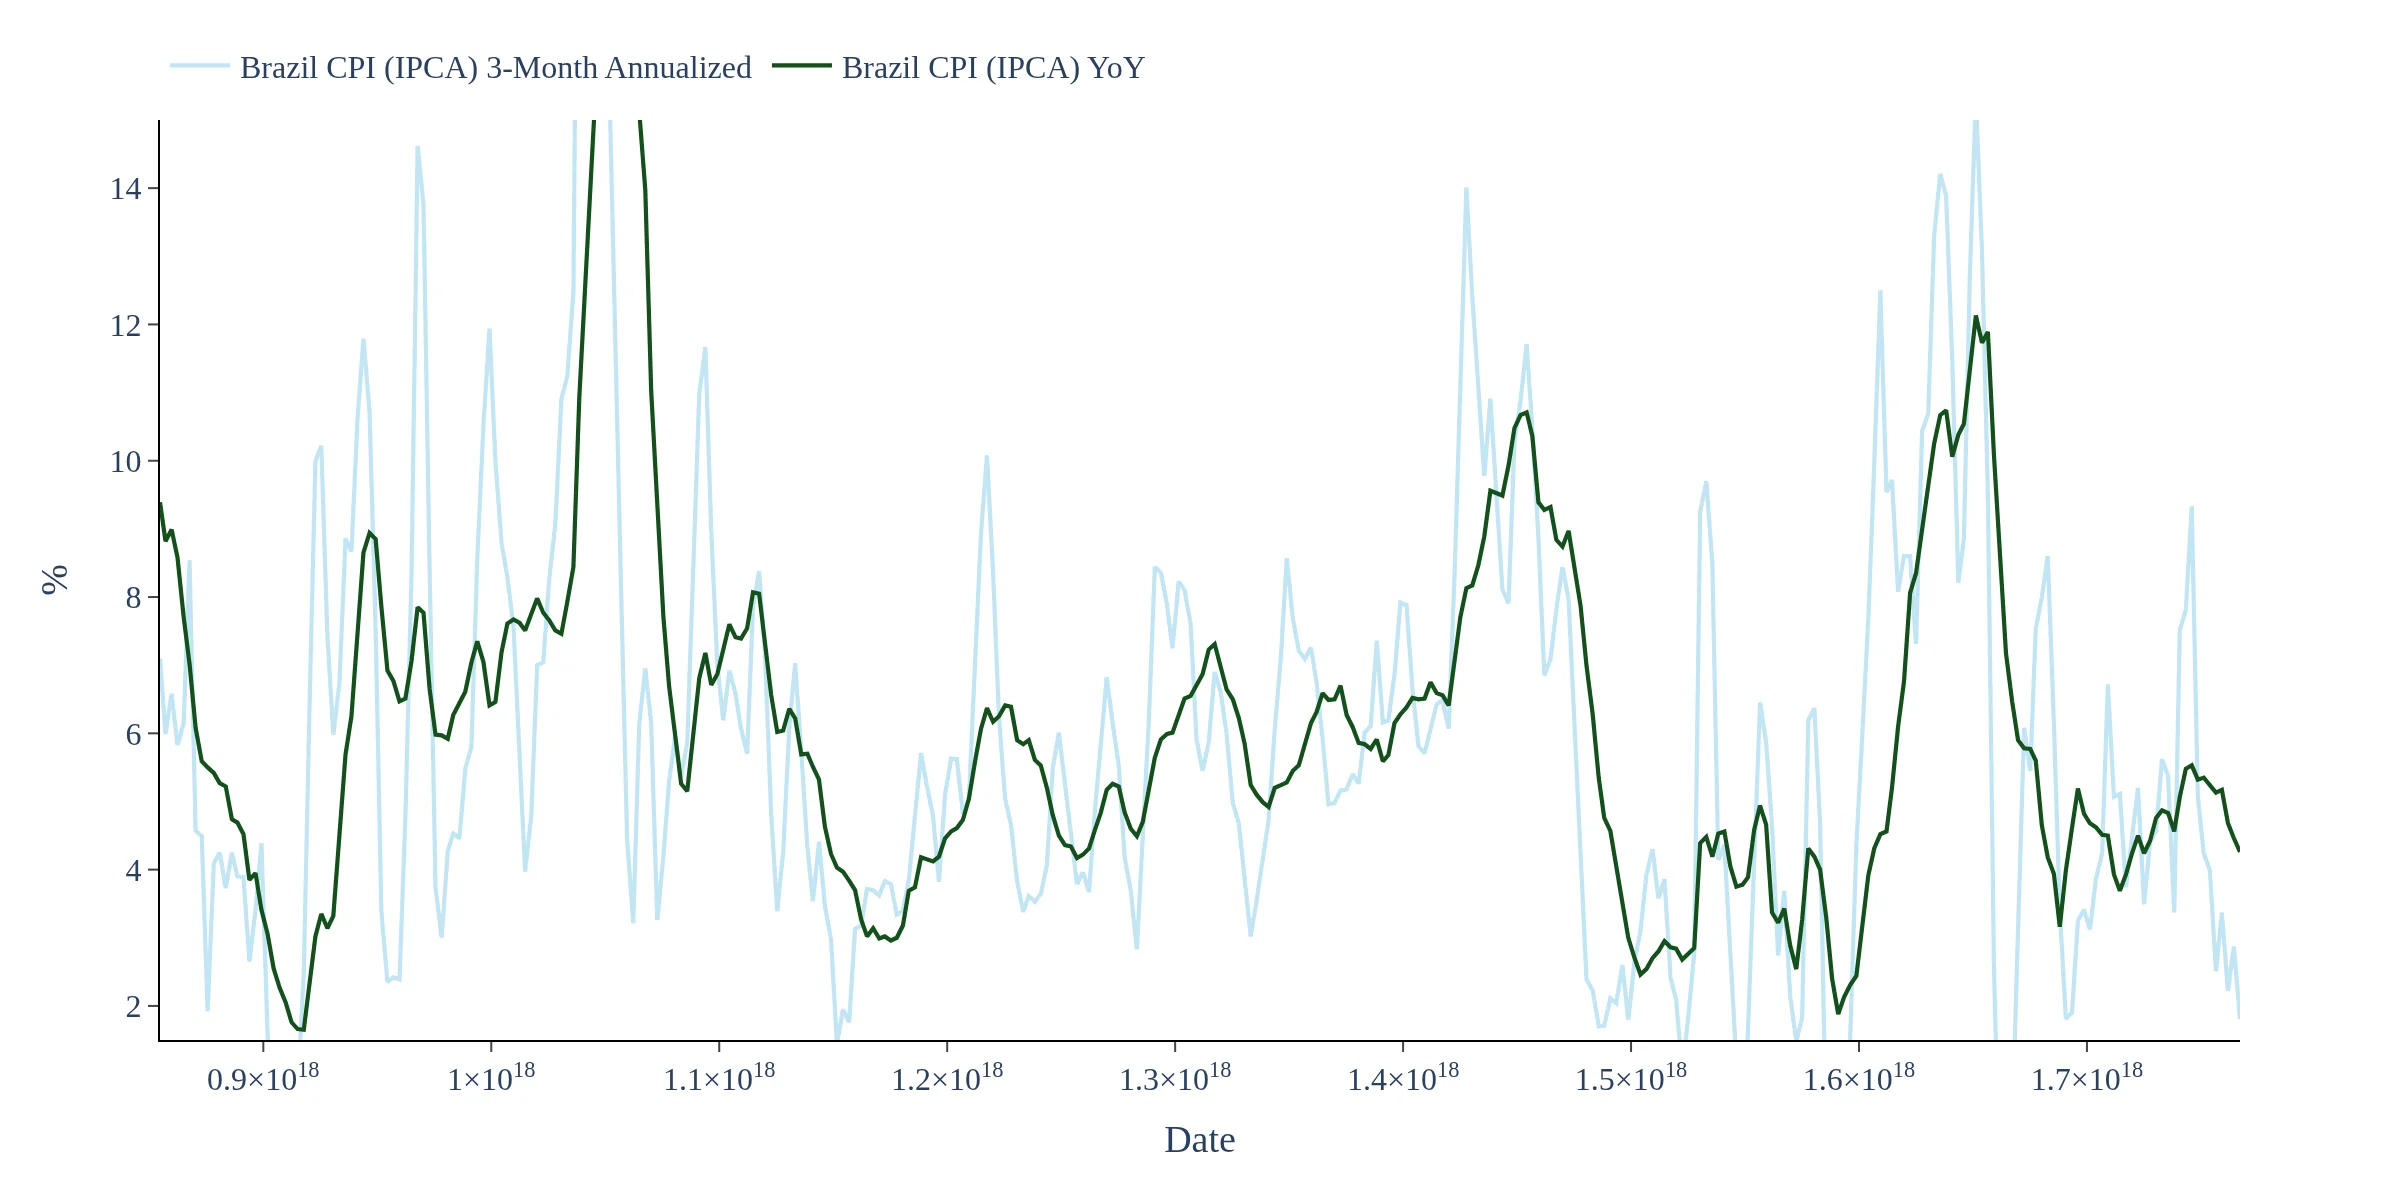
Visualize how Brazil's official inflation figures are behaving
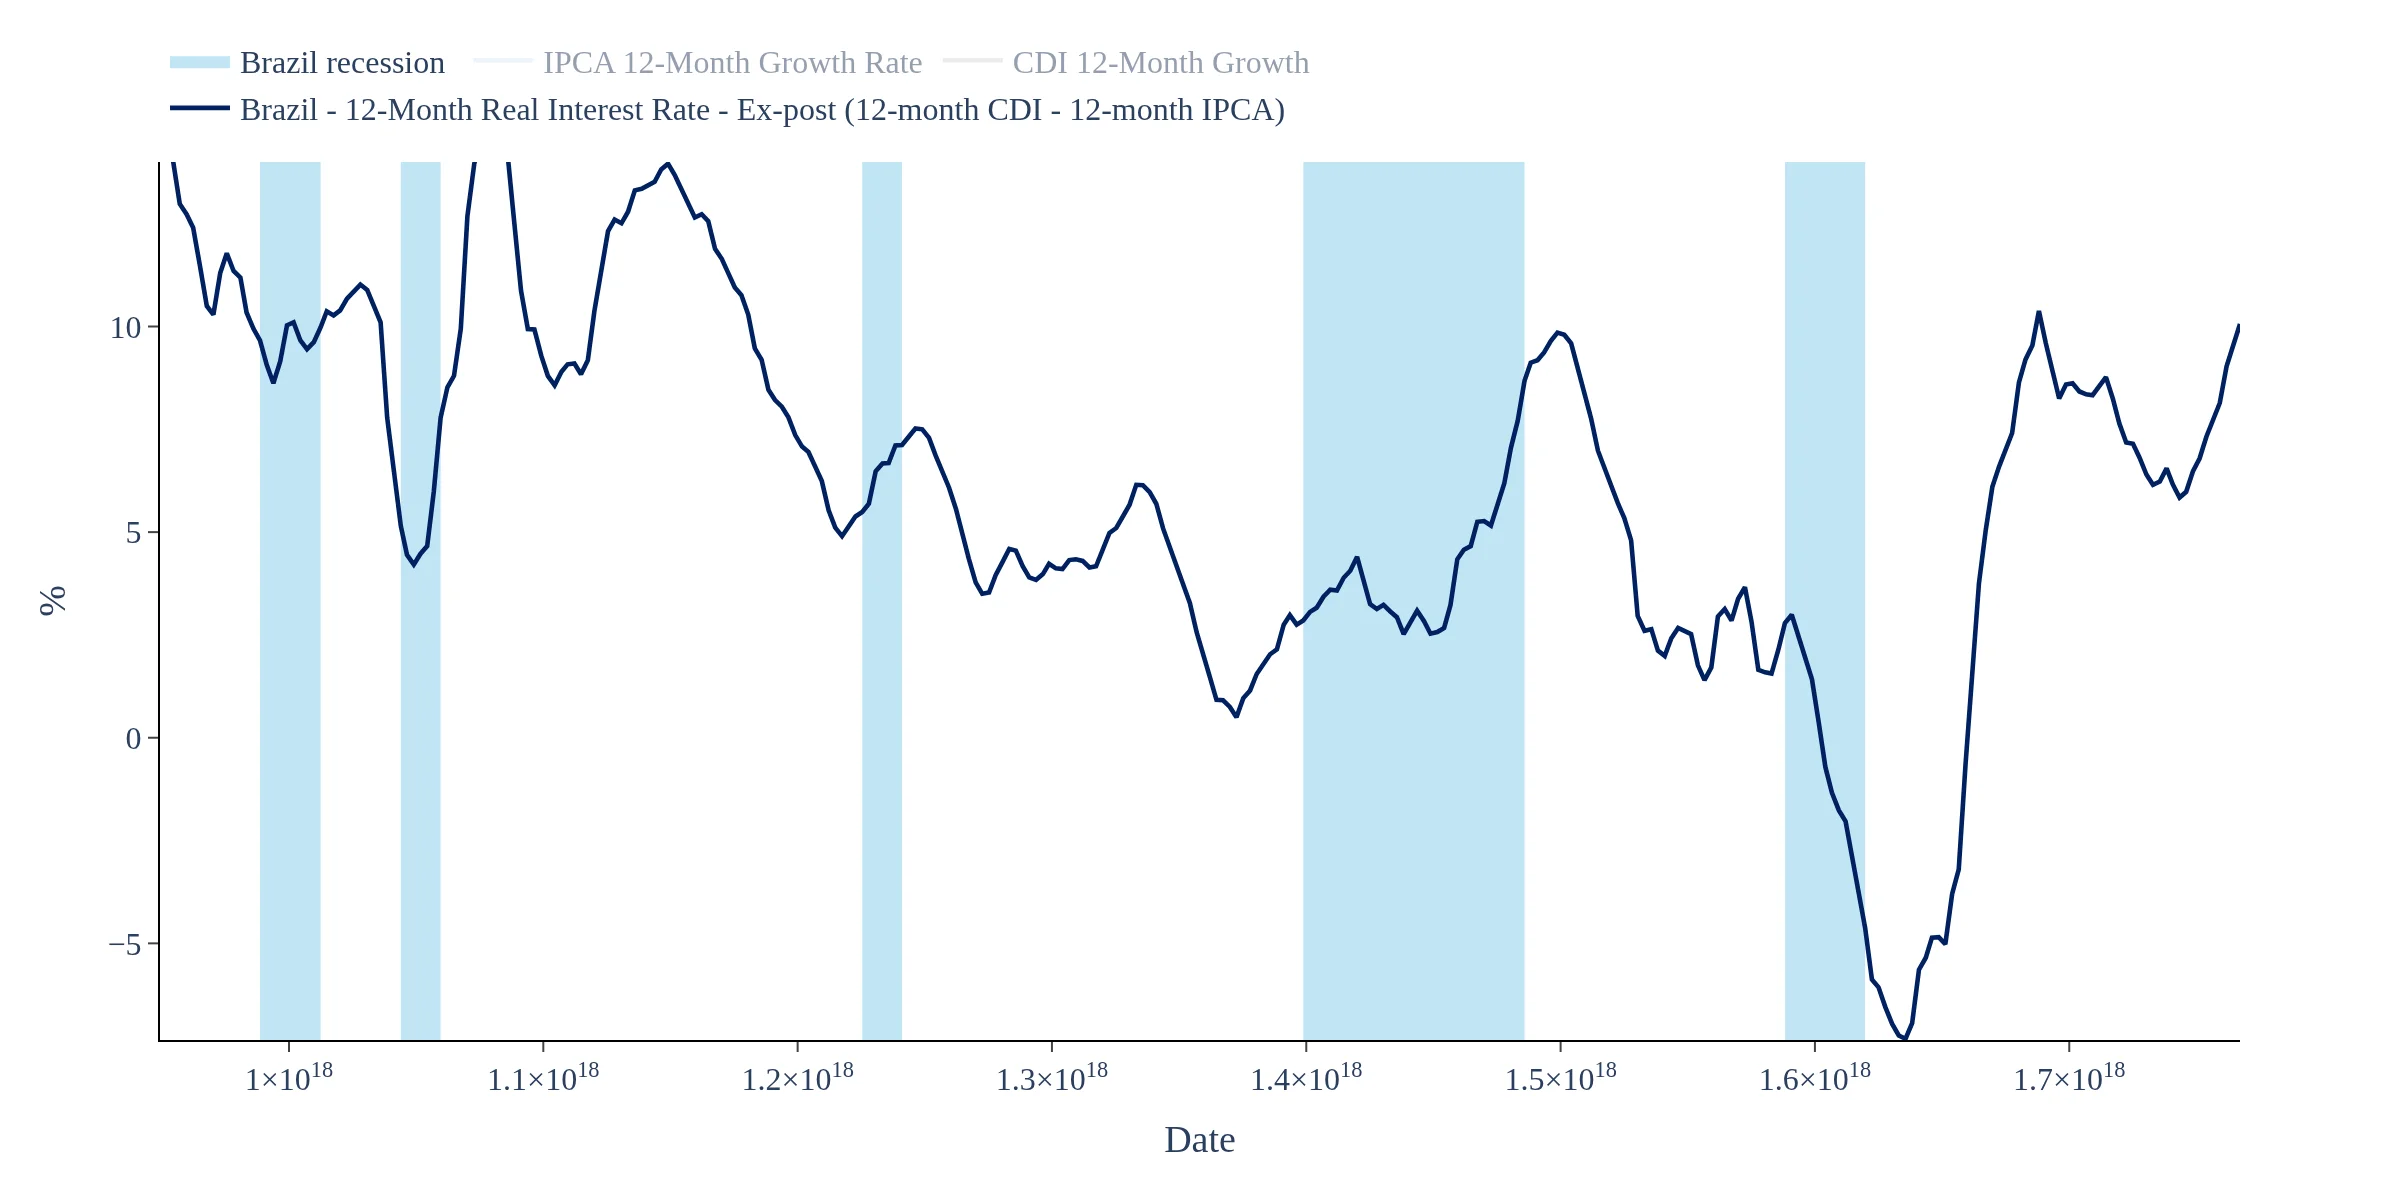
Track how are real interest rates in Brazil, from an ex-post perspective (realized 12-month benchmark rate growth - 12-month inflation)
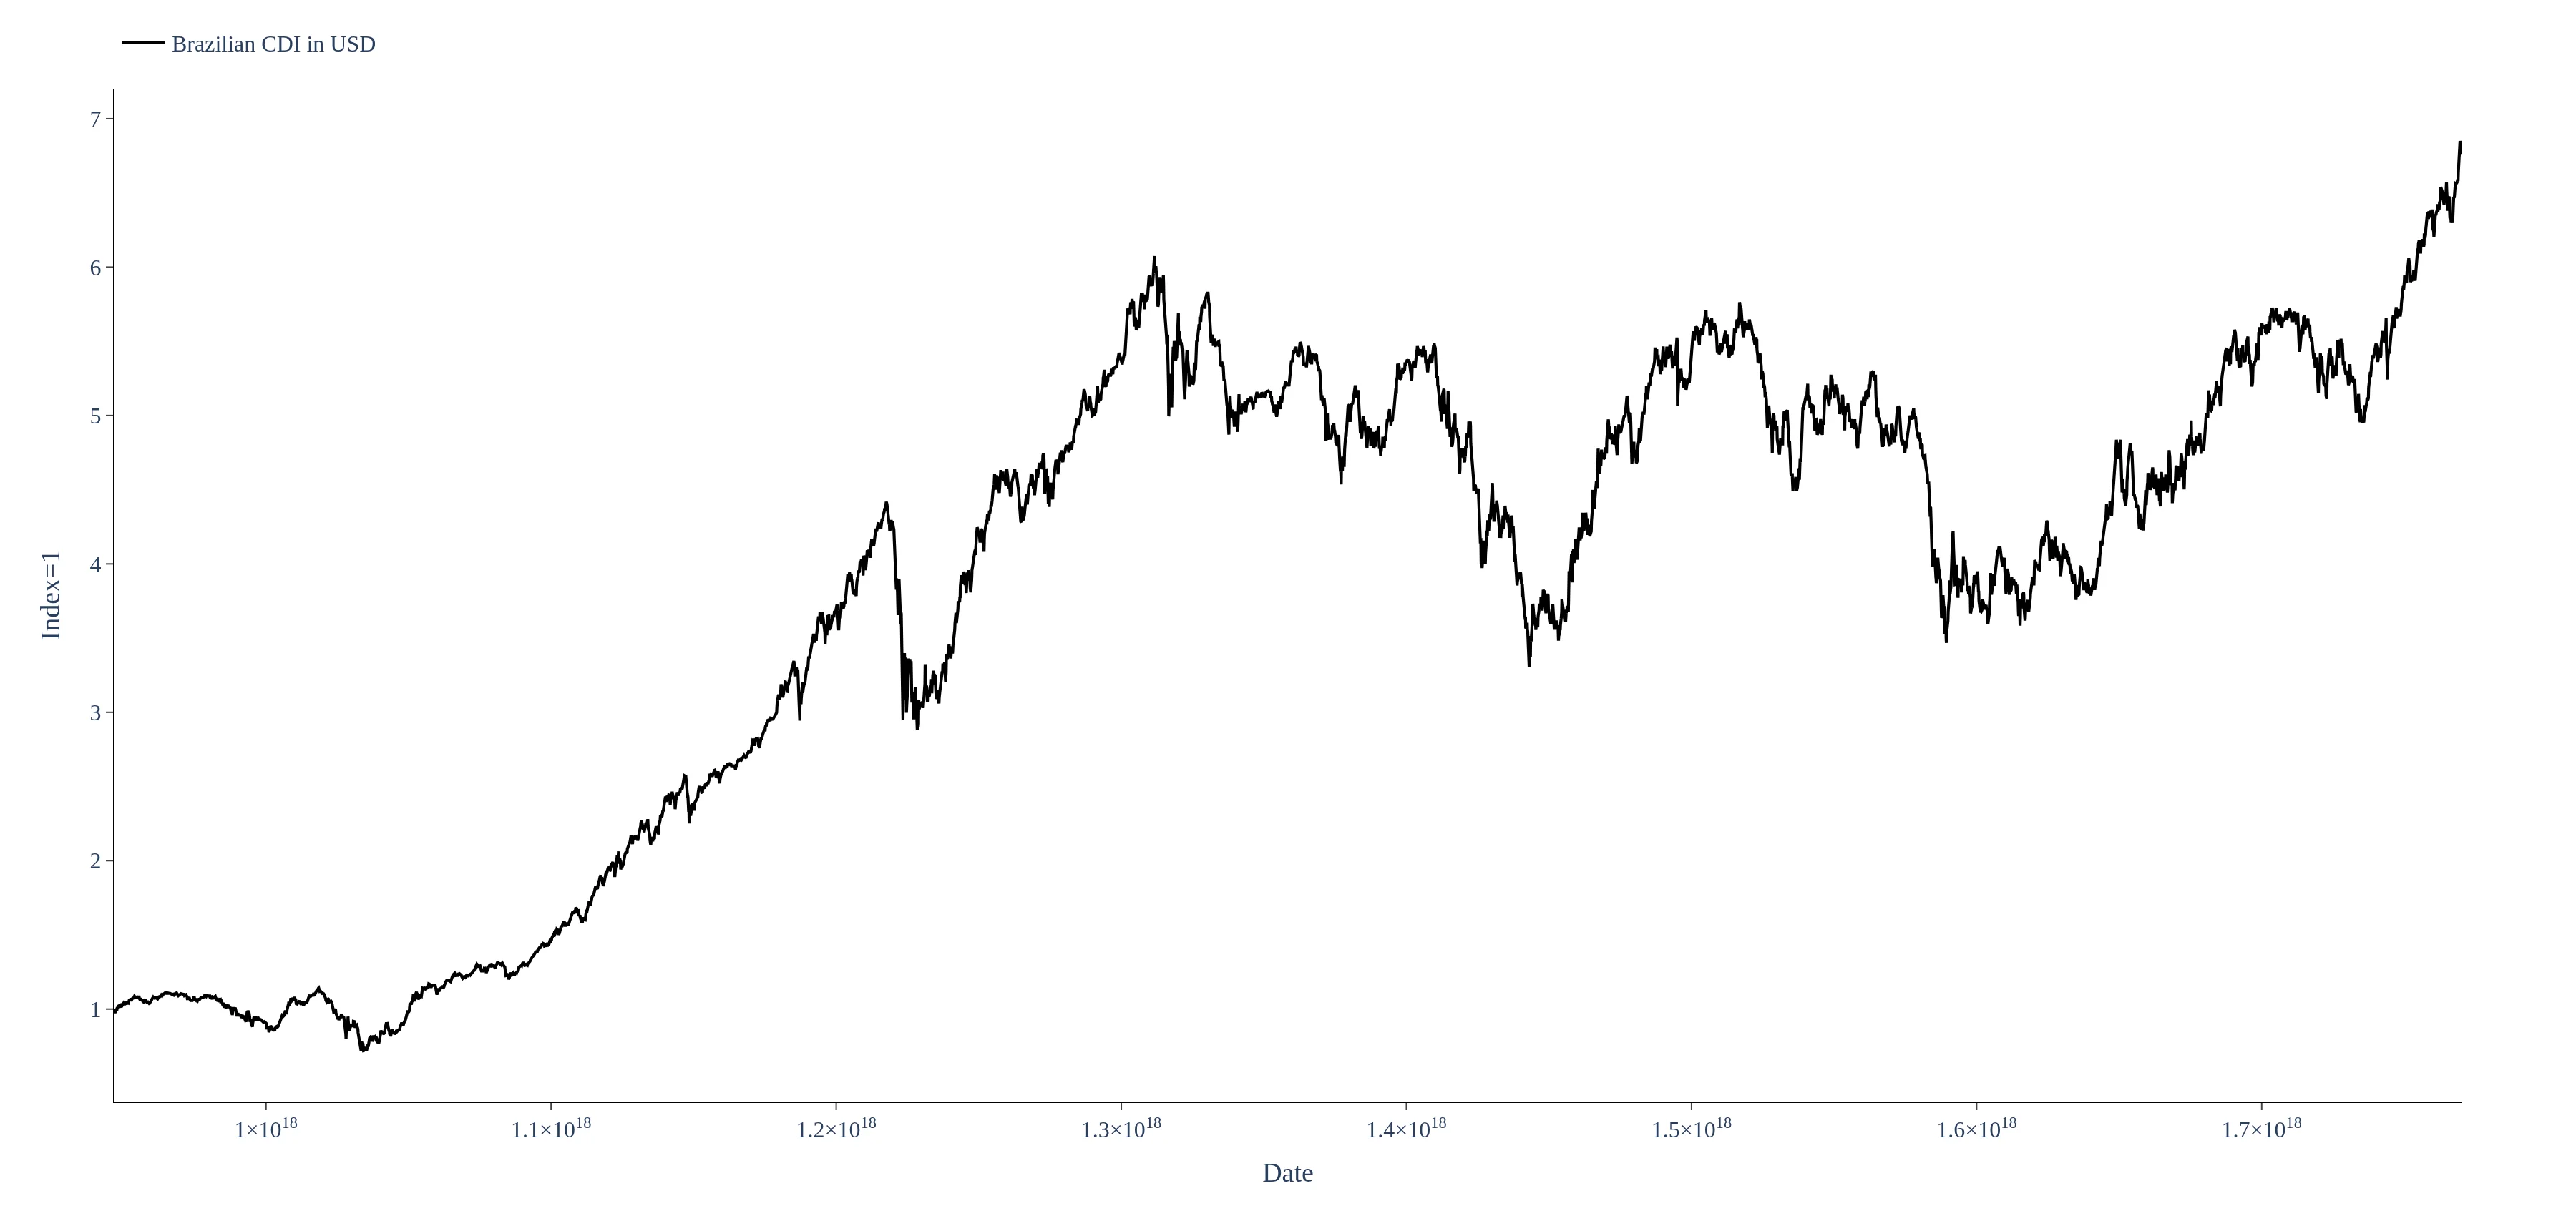
Get insights into how the Brazilian CDI index is performing in USD terms