Analyze Mexico's biweekly inflation print across headline, core, non-core, goods and services CPI.
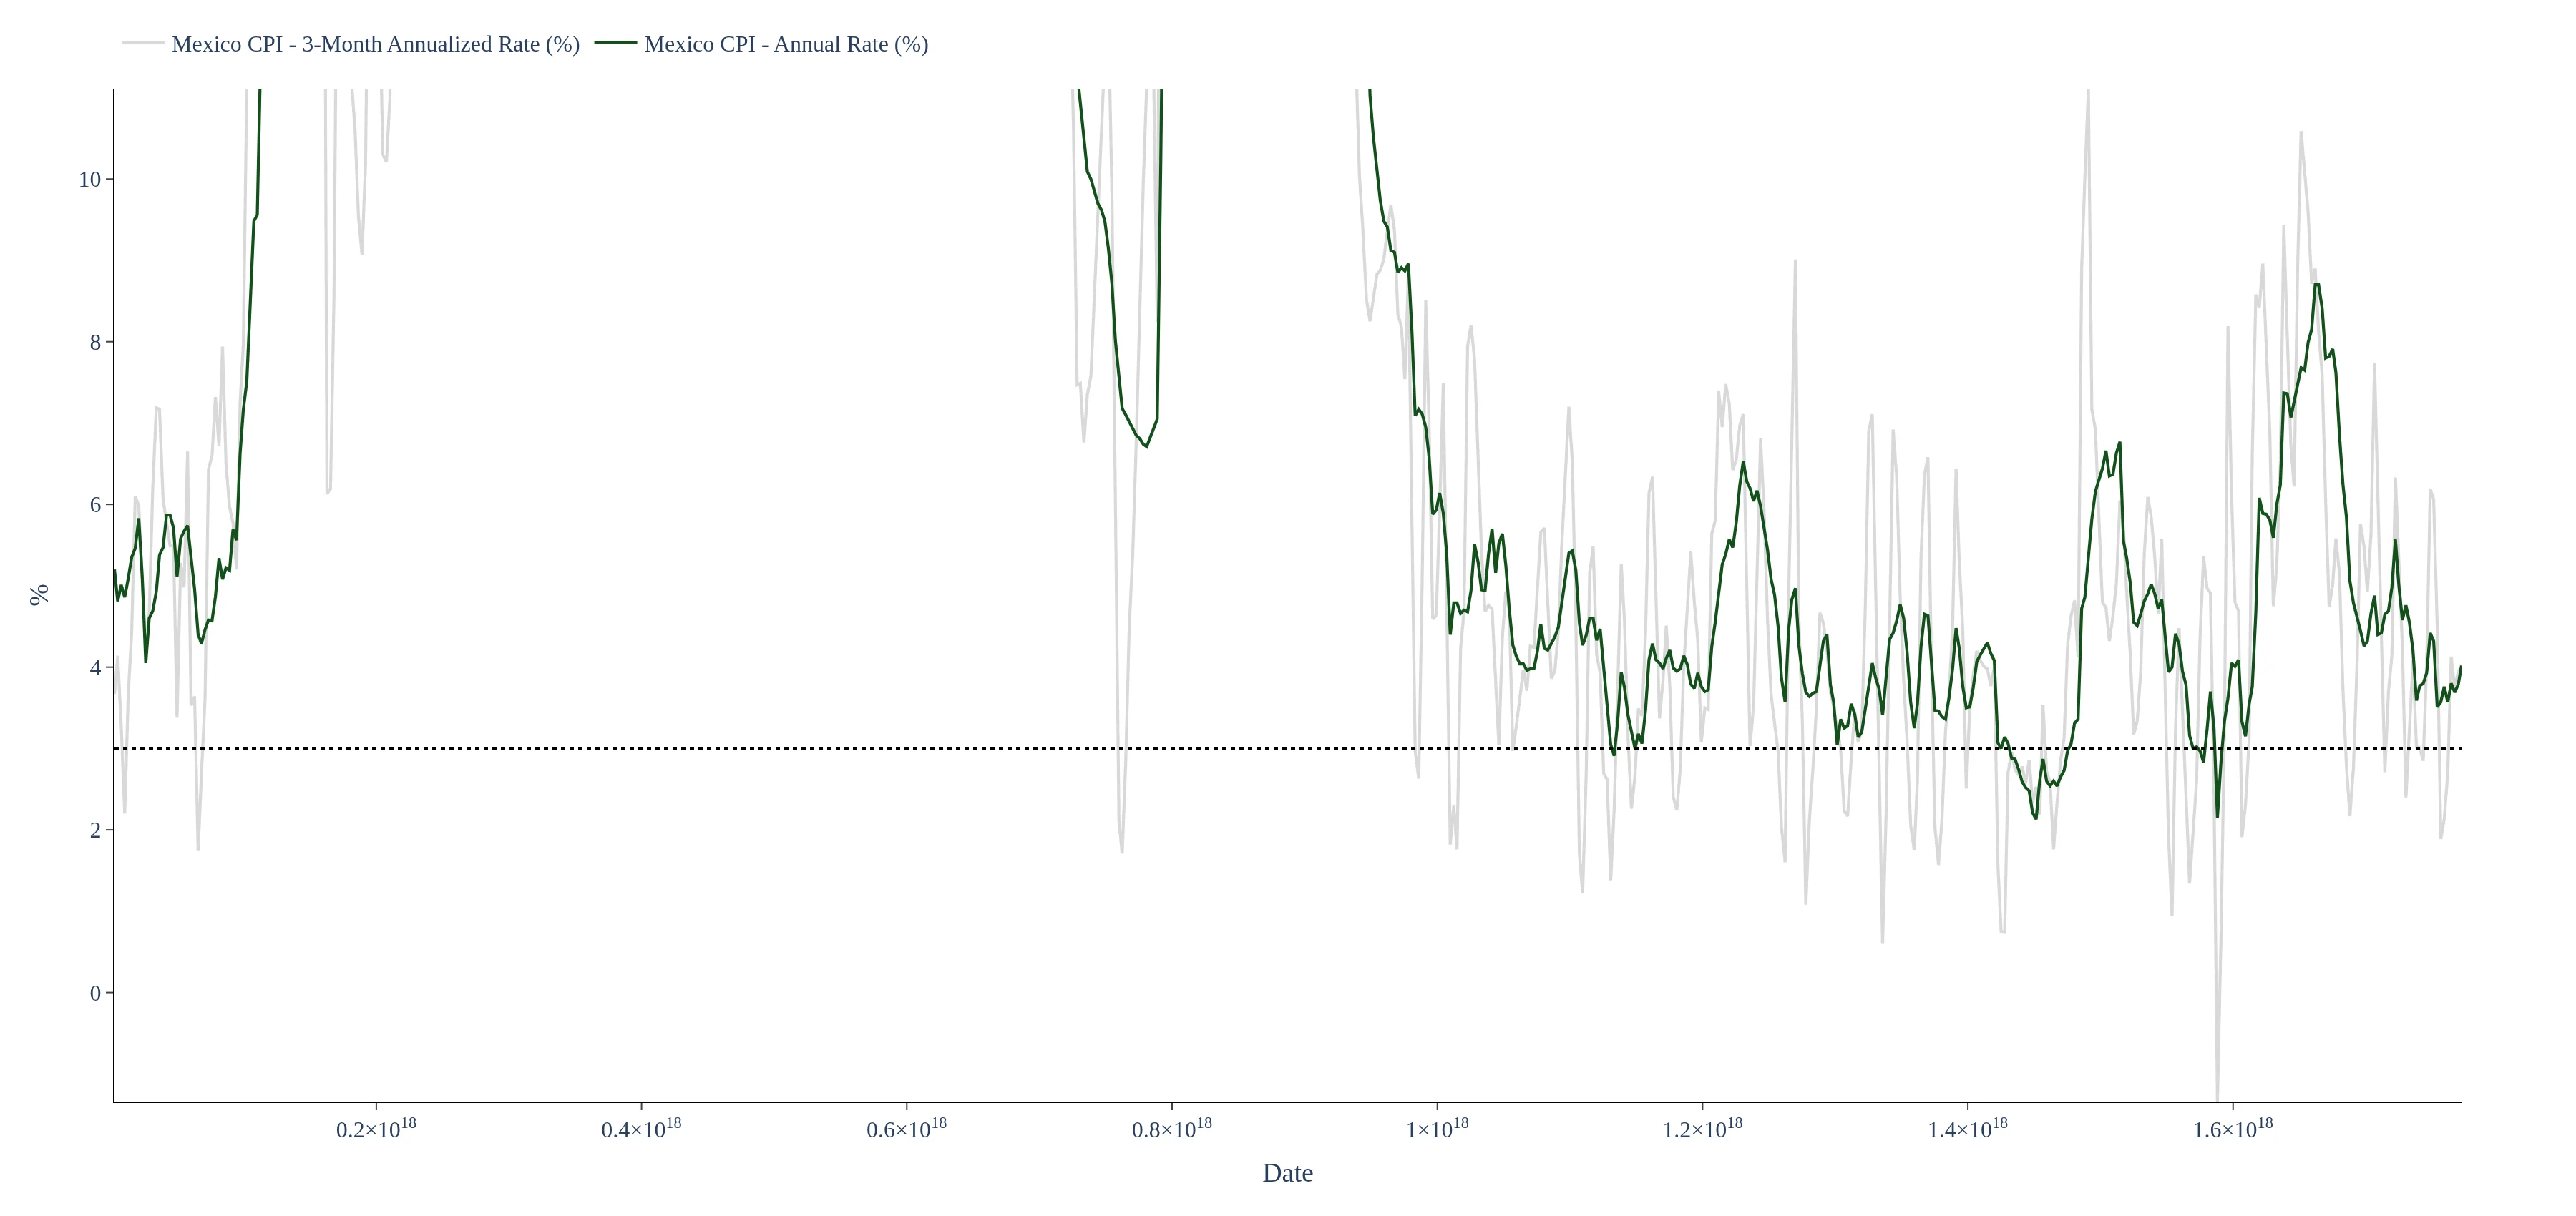
Mexico's biweekly inflation is calculated as the percentage change over 24 biweekly observations. The methodology includes both year-over-year (YoY) inflation and three-month annualized inflation using seasonally adjusted indices to provide a comprehensive view of the inflation trends.
Core inflation data in the Mexico Biweekly Inflation Watch excludes volatile items such as food and energy, providing a clearer picture of underlying inflation trends. This metric is essential for analysts and investors looking to gauge the stability of the economy.
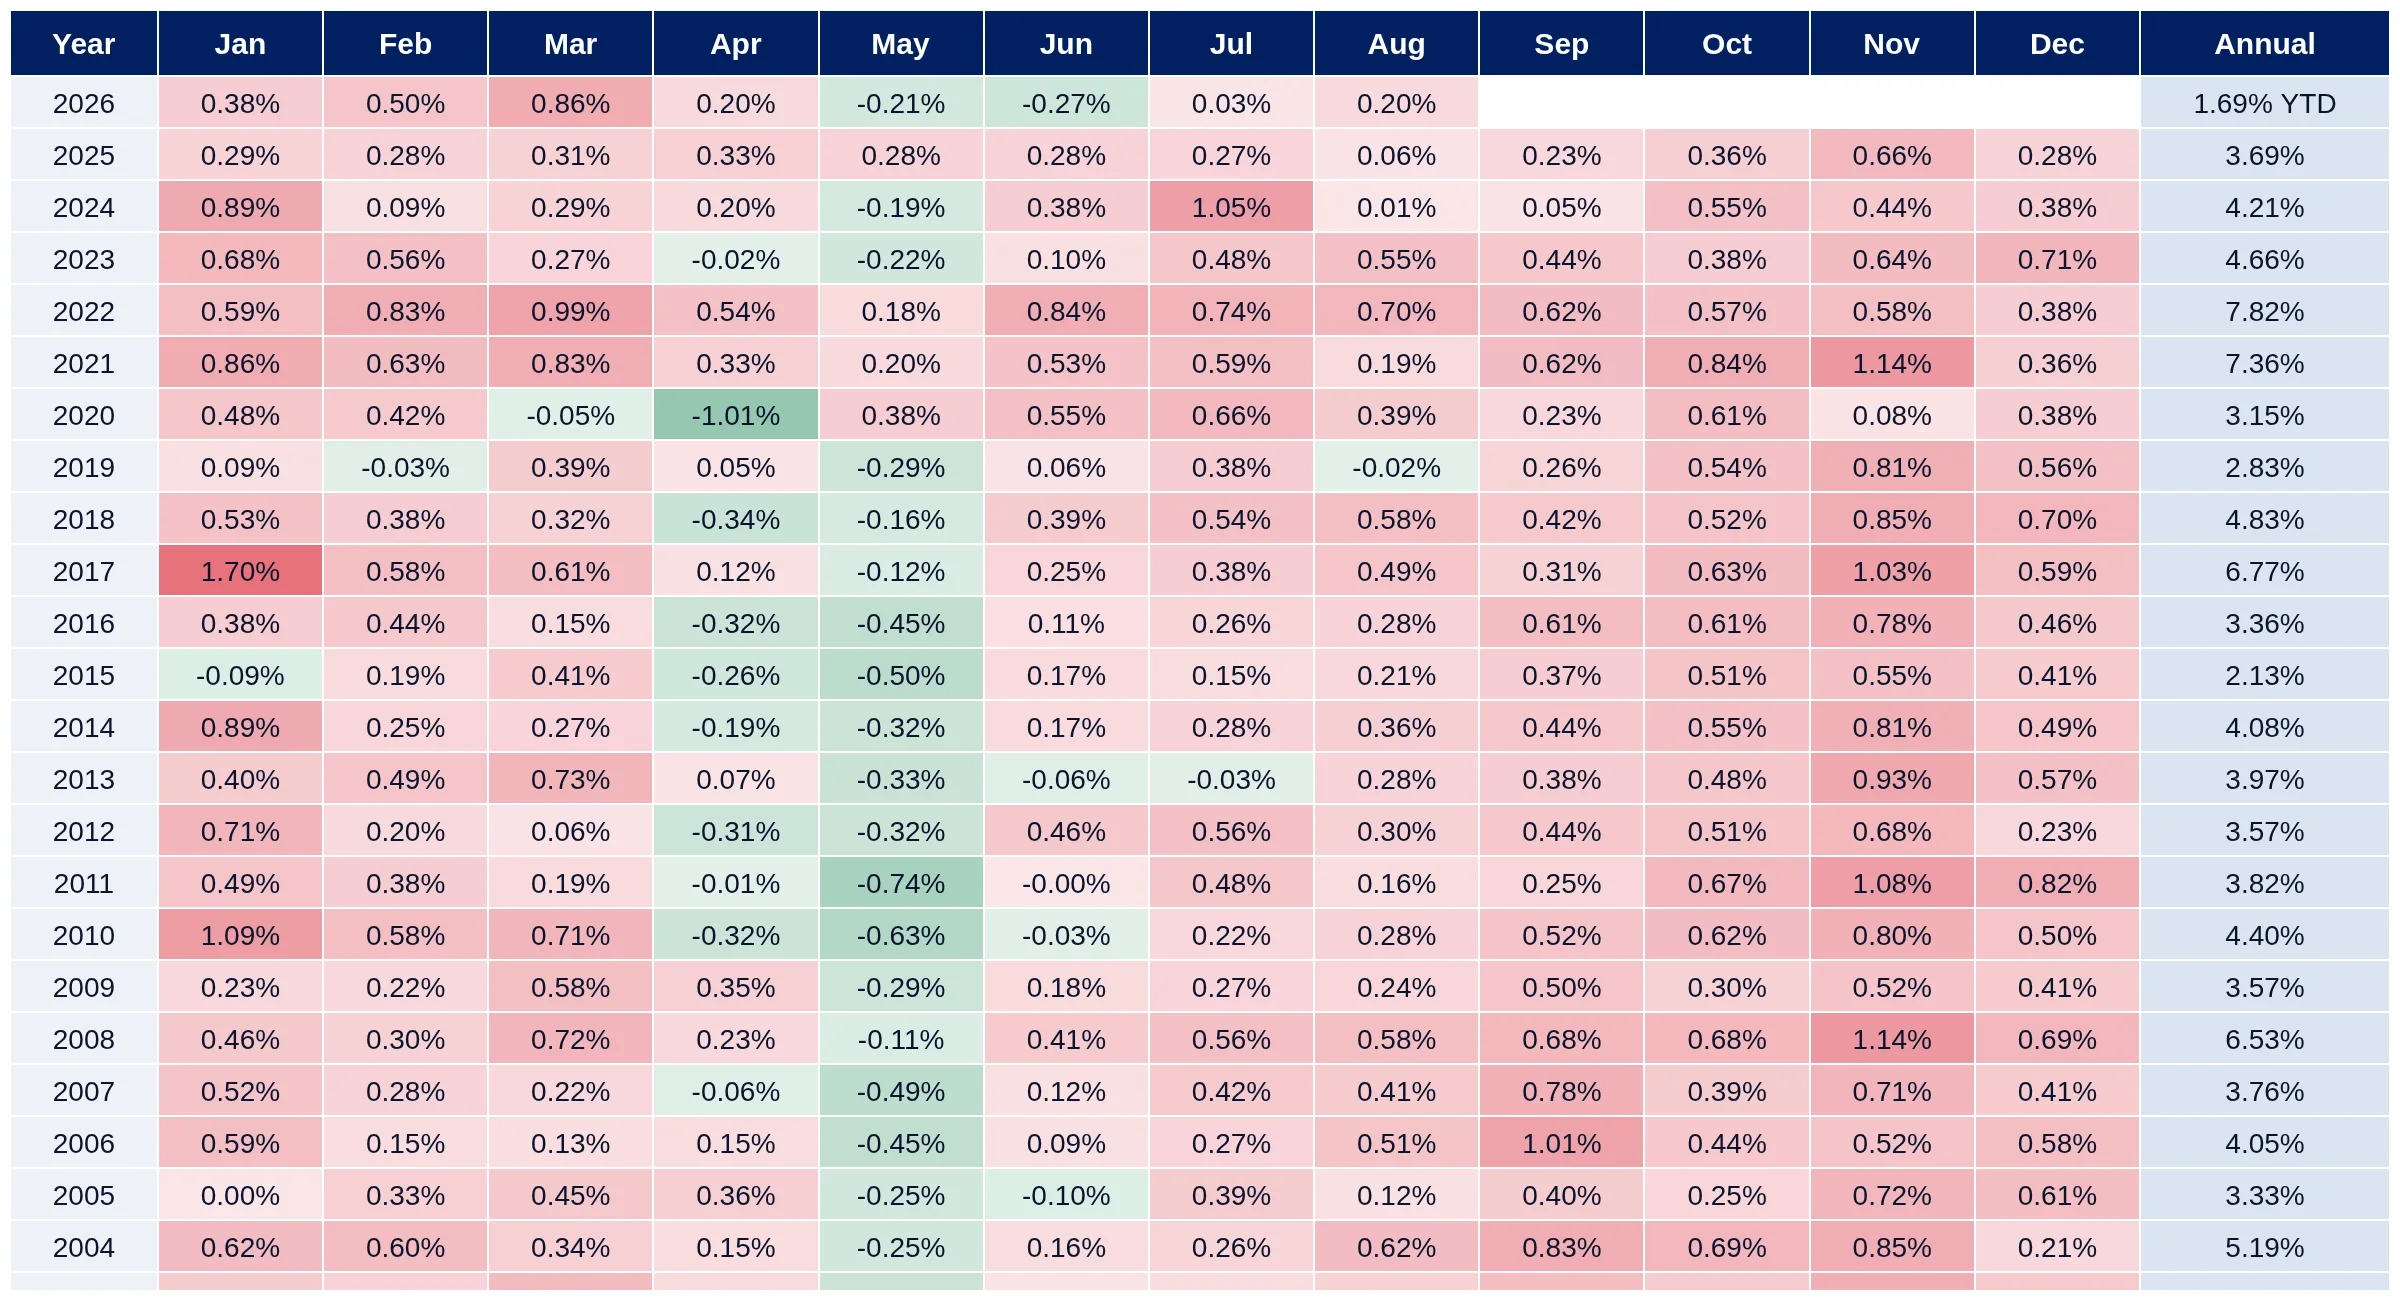
The seasonal comparison charts in the Mexico Biweekly Inflation Watch allow users to analyze each biweekly non-seasonally adjusted (NSA) change against the previous observation. These charts highlight historical minimum and maximum ranges for each half-month, enabling traders and analysts to identify seasonal patterns and potential inflationary pressures.
YoY inflation is calculated as the percentage change over 24 observations. Three-month annualized inflation uses seasonally adjusted indices and a six-observation change annualized to four quarters. The two half-month series are seasonally adjusted separately to preserve their distinct seasonal patterns. The seasonal comparison charts calculate each biweekly NSA change against the immediately preceding observation and retain 24 categories per year, from Jan 1H through Dec 2H. Shaded ranges show the historical minimum and maximum for each corresponding half-month. Data is based on Mexico's official biweekly CPI series.