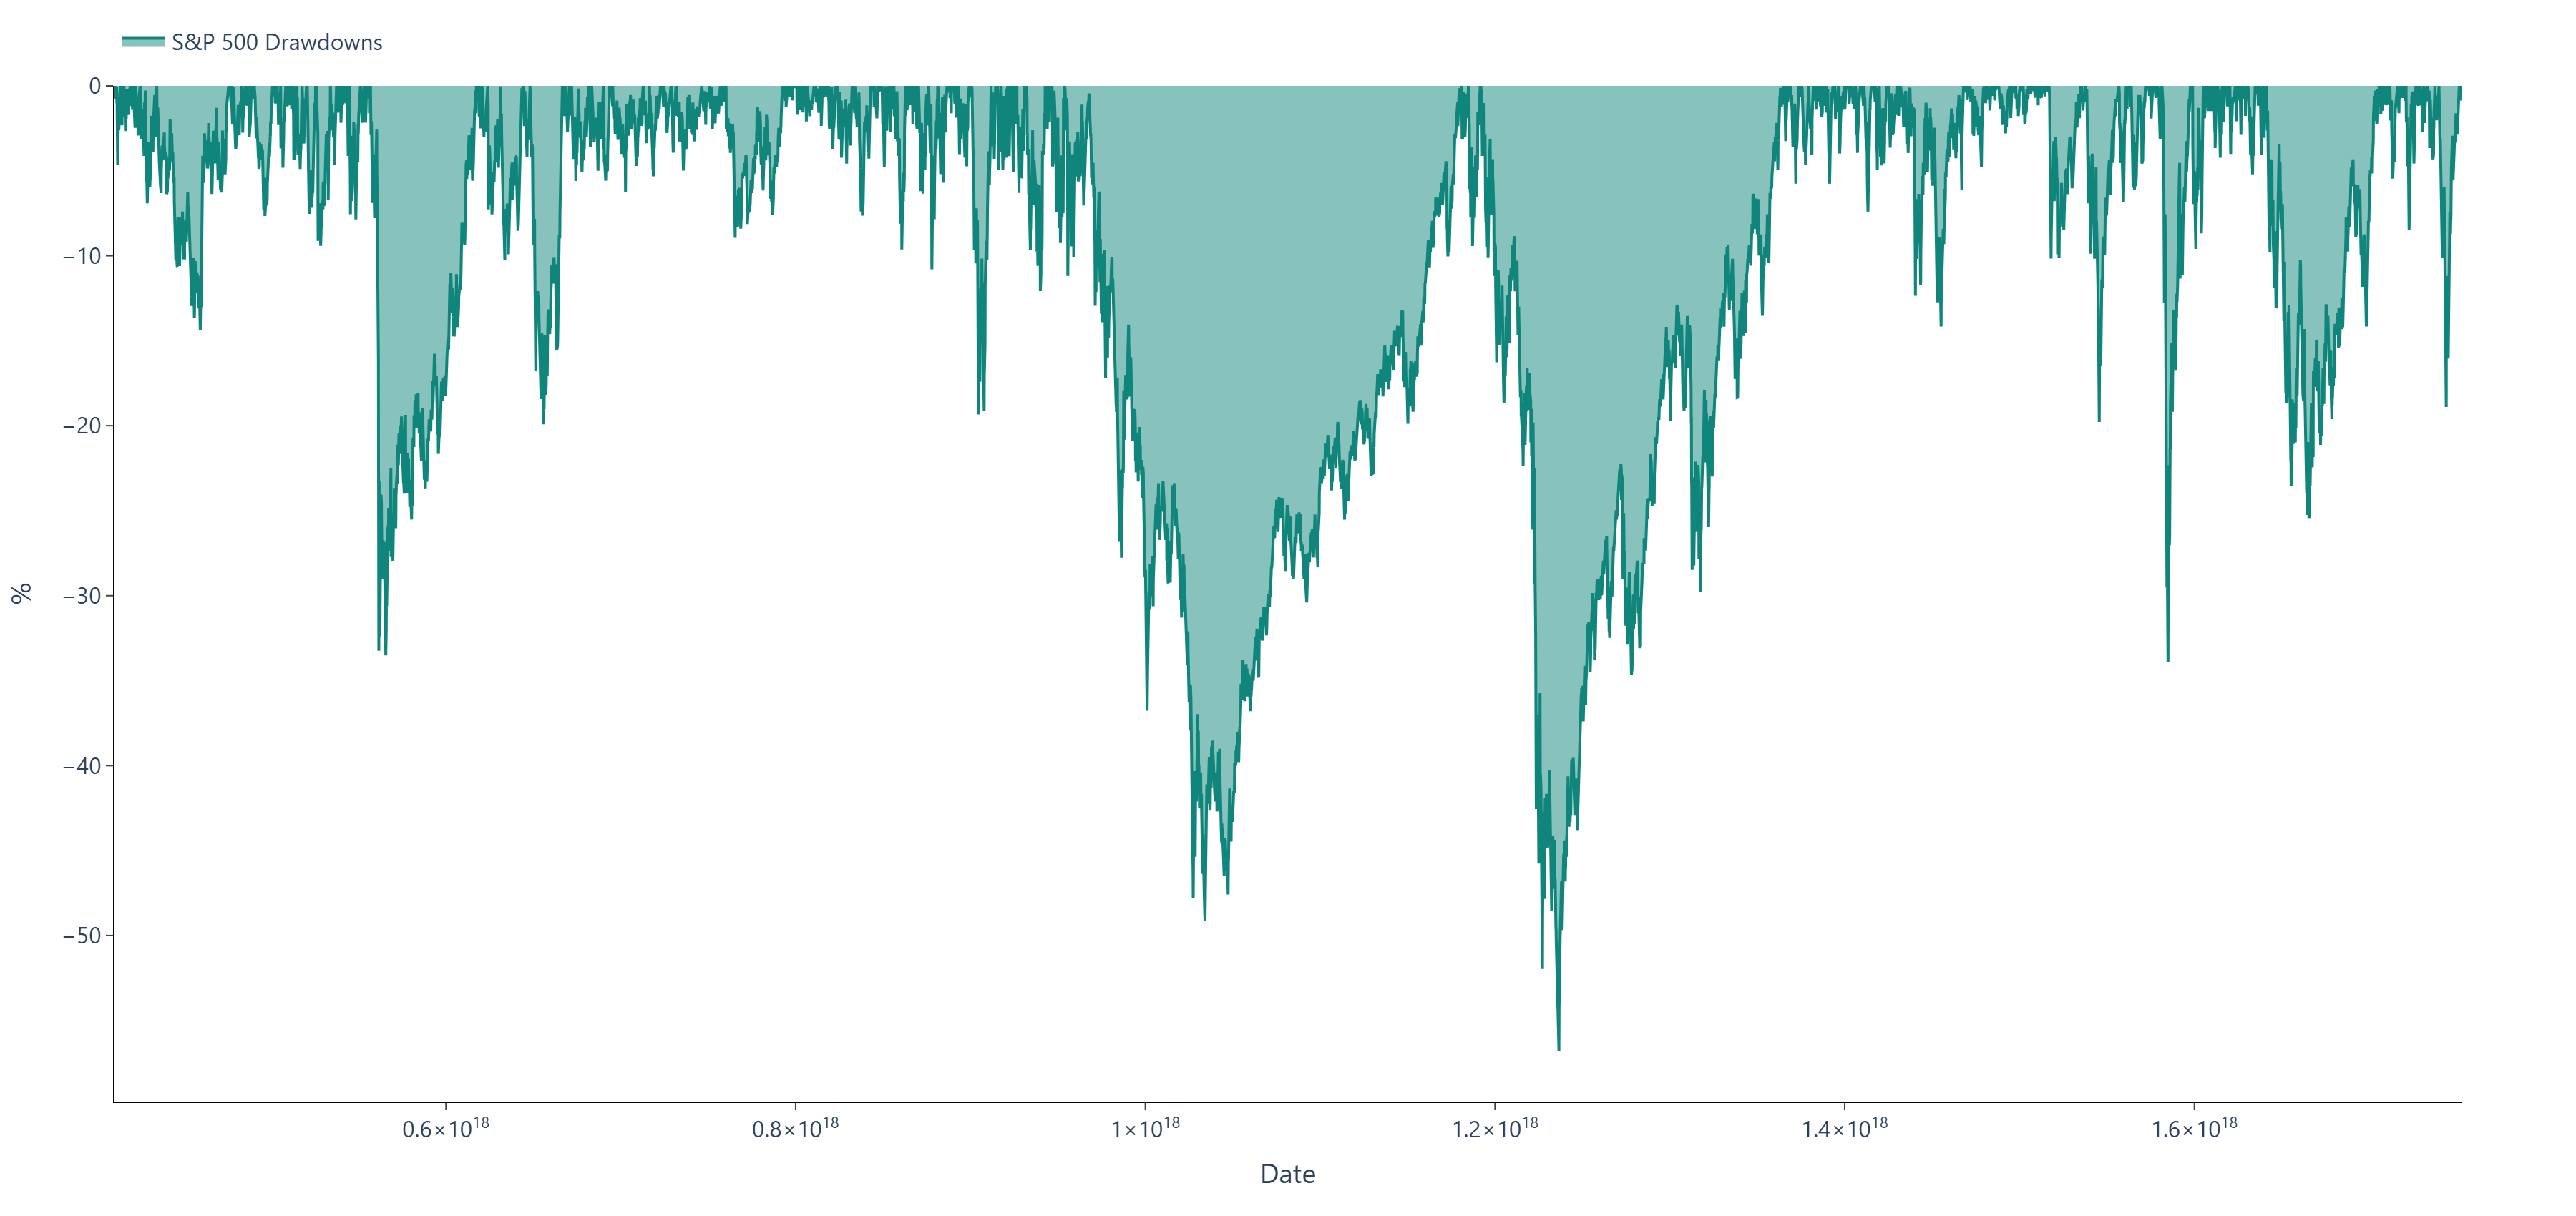
JKHY maximum and latest drawdown
Jack Henry & Associates (JKHY) recorded a maximum drawdown of -73.43% on Oct 09, 2002 in the available history from Nov 01, 1999 through Nov 20, 2026. It recovered to its previous peak on Dec 02, 2010.
The latest recorded drawdown was -14.14% on Nov 20, 2026.
JKHY Historical Drawdowns (%)
Largest JKHY drawdowns
| Peak date | Trough date | Drawdown | Recovery date |
|---|---|---|---|
| Jul 13, 2001 | Oct 09, 2002 | -73.43% | Dec 02, 2010 |
| Dec 27, 2000 | Apr 04, 2001 | -39.93% | Jul 13, 2001 |
| Aug 05, 2022 | Jun 22, 2026 | -38.37% | Unrecovered |
| Apr 06, 2011 | Aug 08, 2011 | -27.26% | Dec 09, 2011 |
| Aug 17, 2020 | Jan 29, 2021 | -26.90% | Mar 29, 2022 |
How stock drawdowns are calculated
Each daily drawdown is the percentage change from the highest adjusted closing price observed so far in the series. A reading of −20% means the stock closed 20% below that peak. The chart starts at the first available observation on or after 1972.
The history table ranks up to five distinct drawdown episodes by their deepest daily loss. The peak date is the last 0% reading before the decline. The recovery date is the first subsequent 0% reading in the published series, which rounds drawdowns to two decimal places.