Screen to observe the performance of Bitcoin vs MSTR over different time periods.
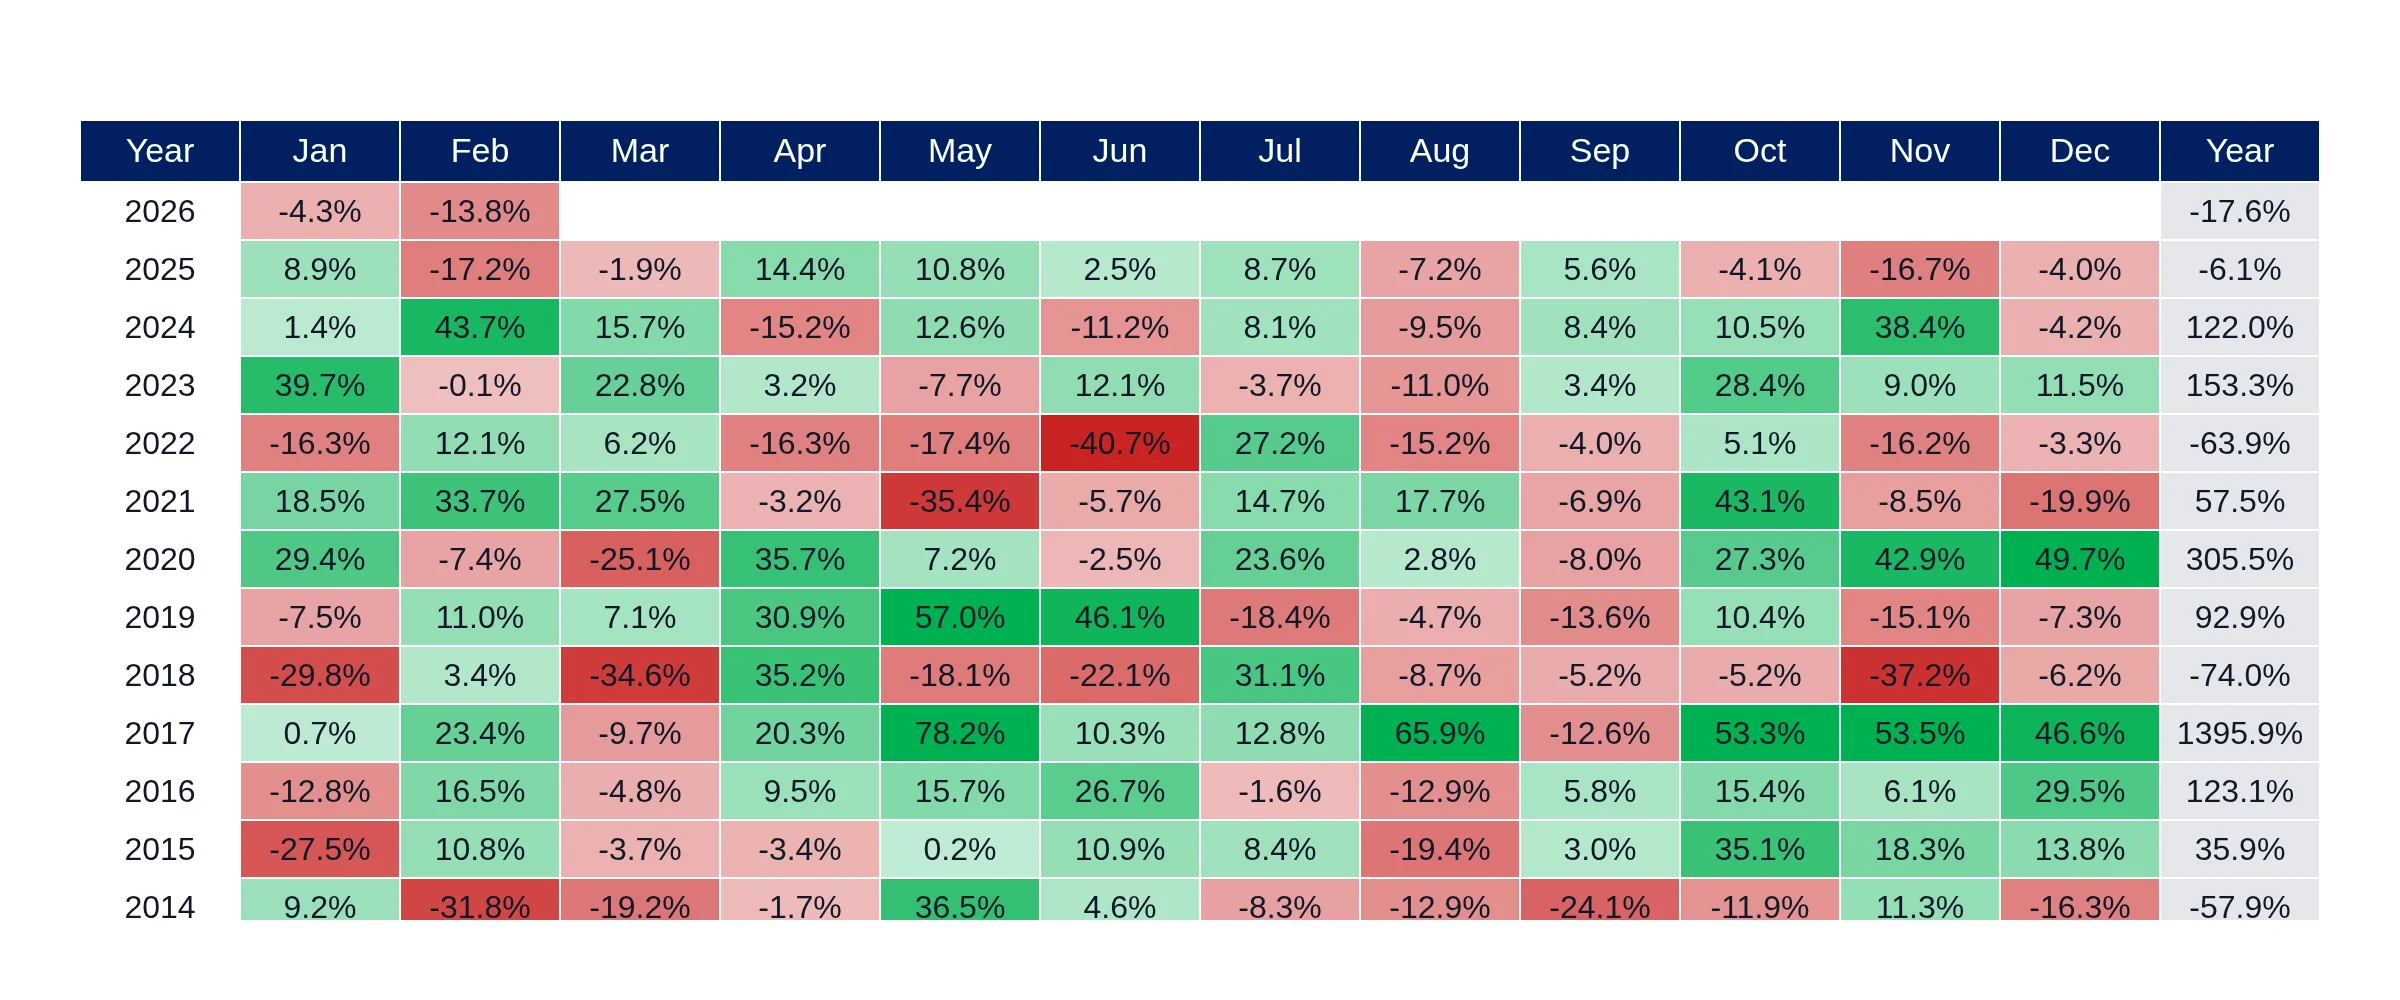
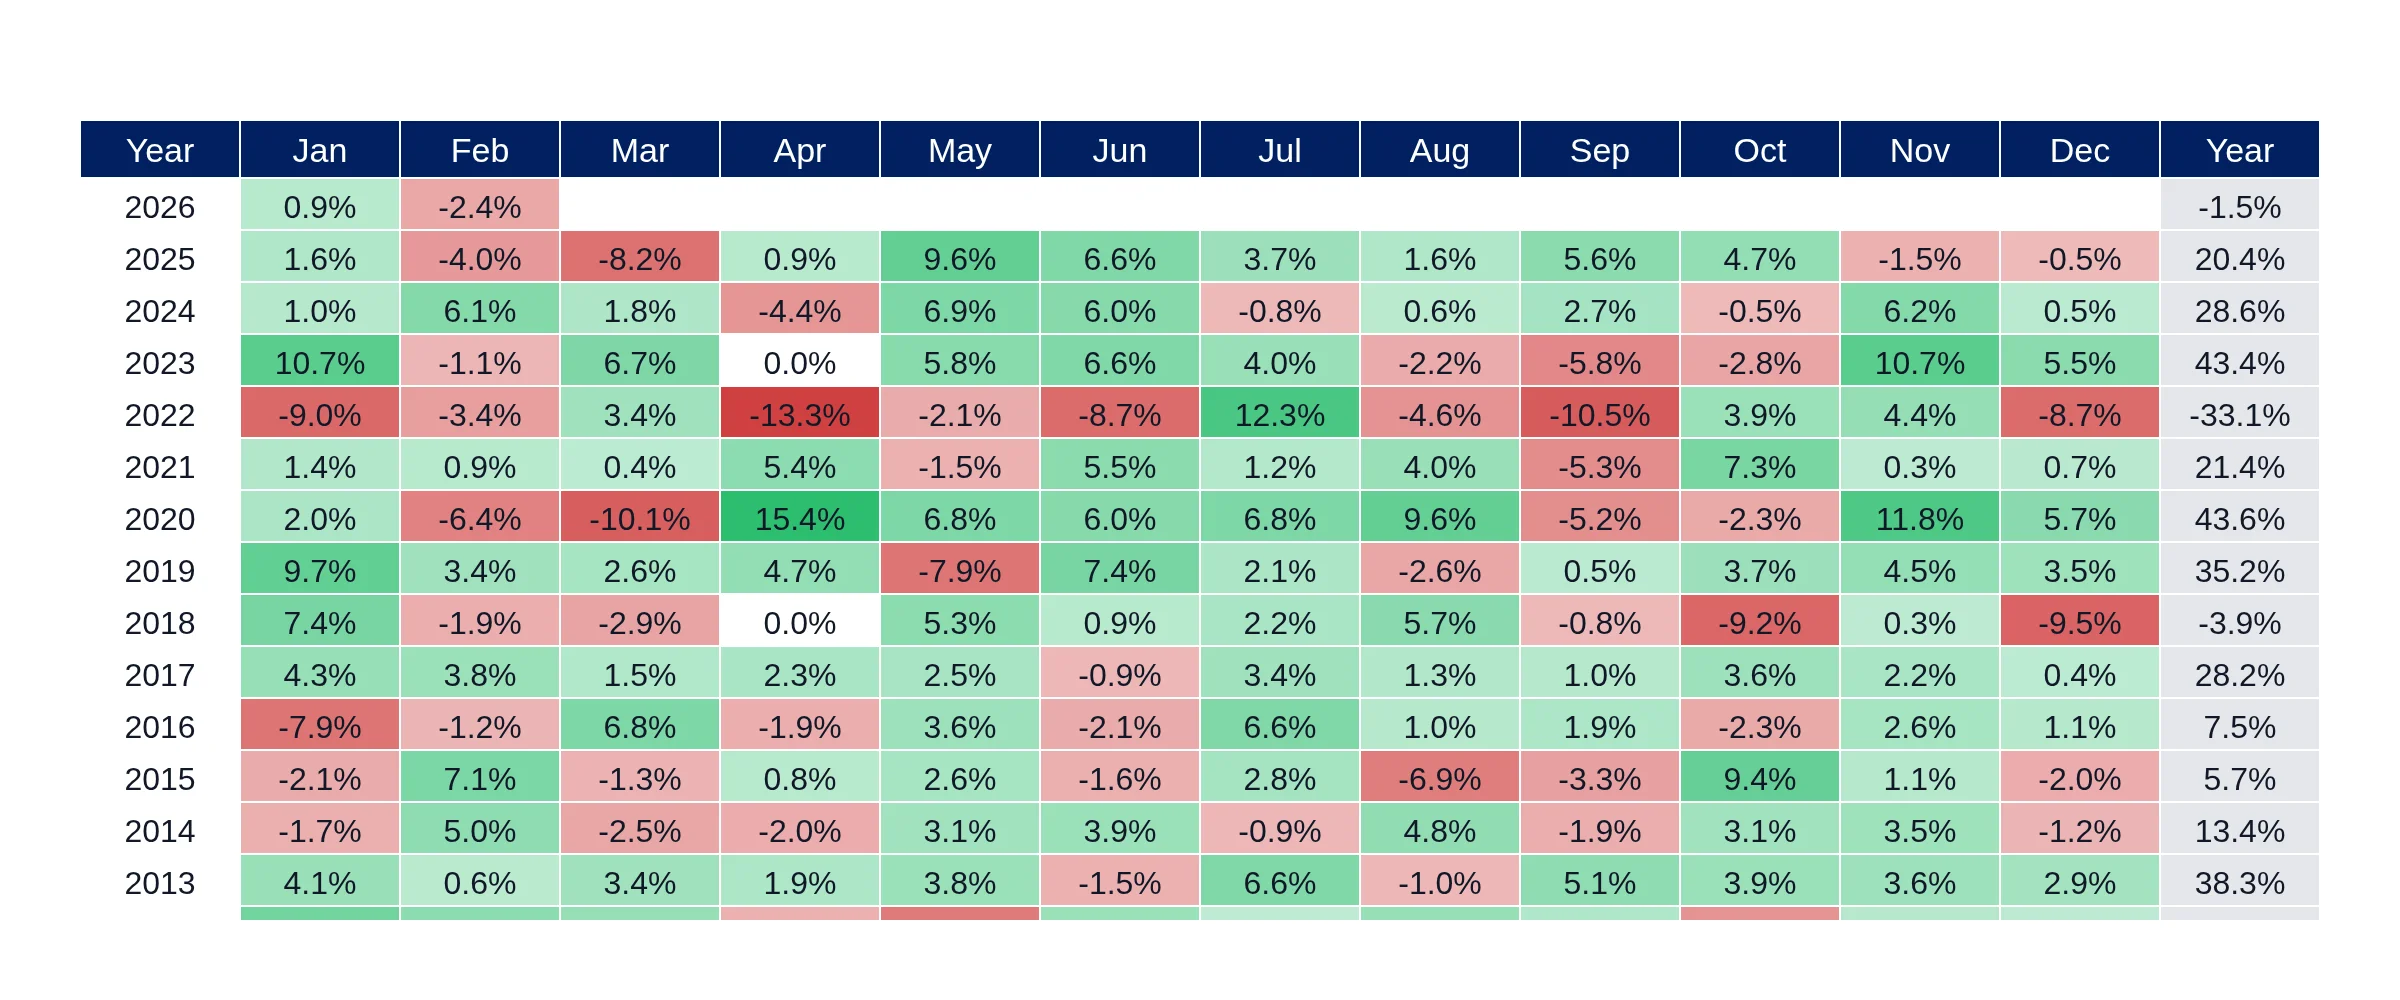
The Bitcoin vs MicroStrategy (MSTR) Performance Monitor dashboard provides a detailed analysis of how MSTR's stock has performed relative to Bitcoin since MicroStrategy began its Bitcoin treasury strategy in late 2020. By using daily price data, the dashboard highlights periods where MSTR amplifies or lags behind Bitcoin's movements, allowing investors to assess relative performance and risk.
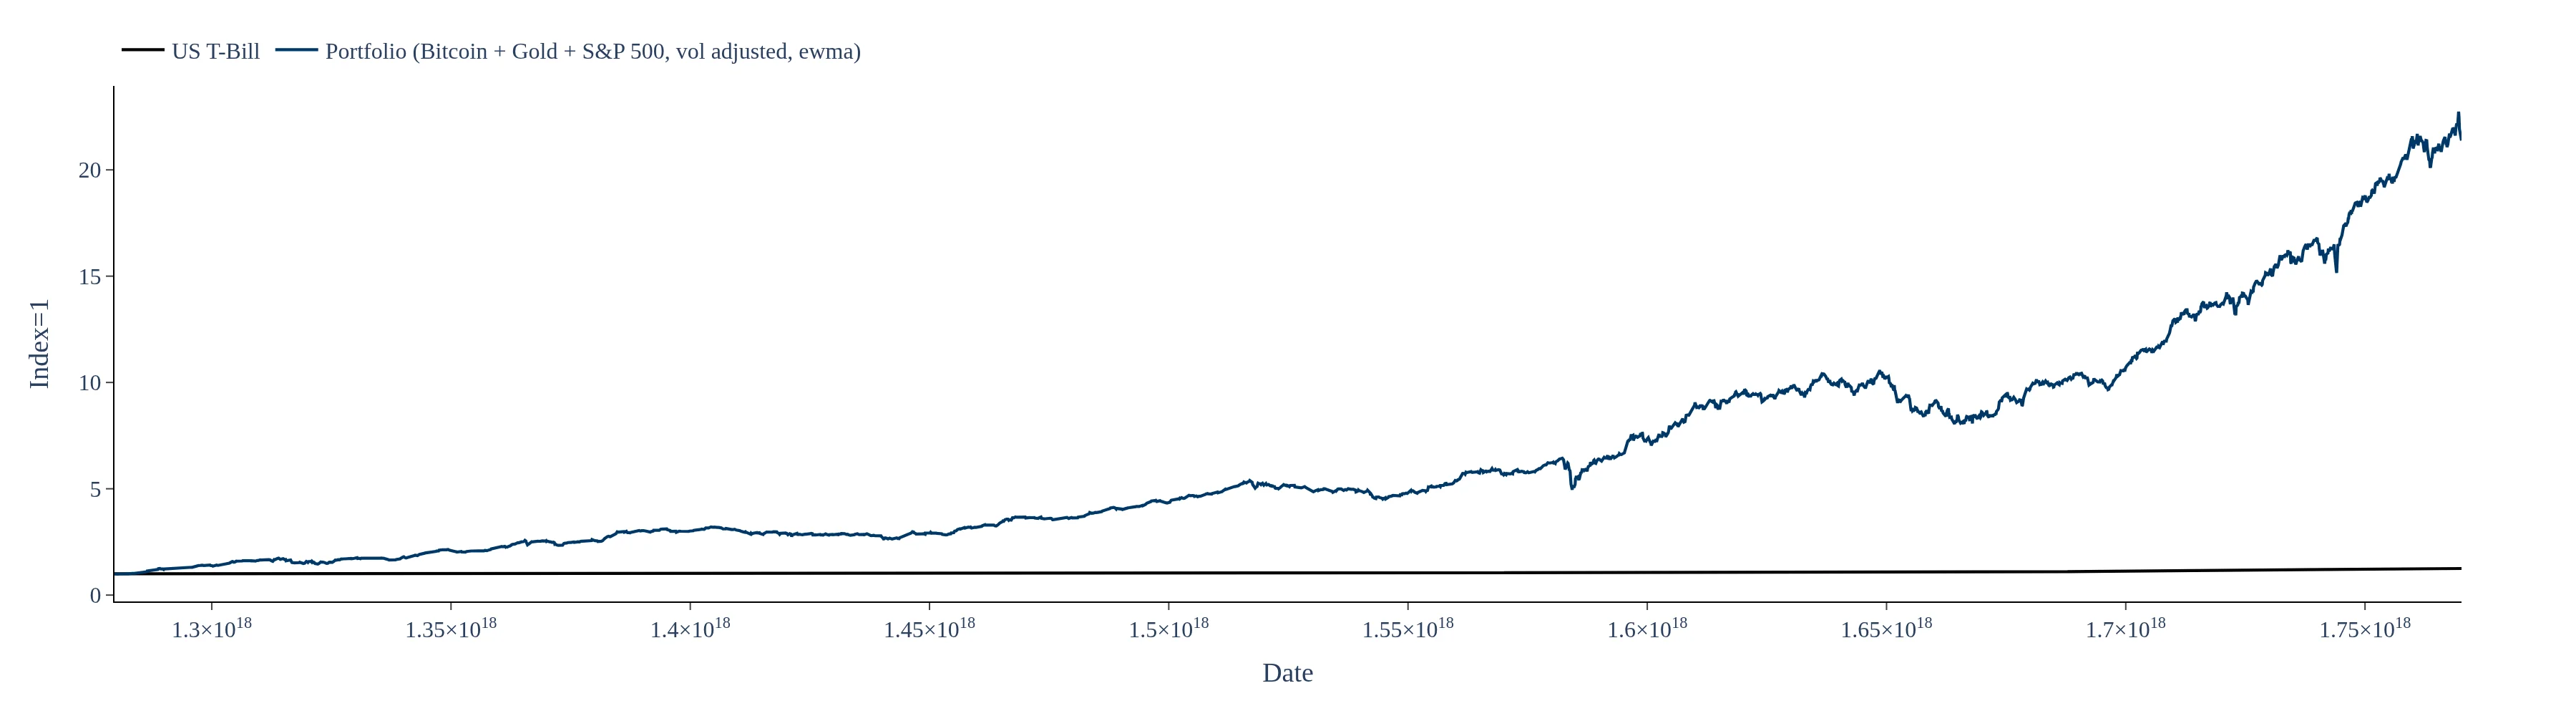
This dashboard allows users to observe the performance of Bitcoin versus MicroStrategy across multiple time windows, including cumulative and rolling returns. Investors can analyze annual returns as well as sliding-window comparisons to evaluate how sensitivity to Bitcoin's price changes over different market regimes.
The Bitcoin vs MicroStrategy Performance Monitor dashboard is updated with recent market prices, ensuring that users have access to the latest data for accurate investment analysis. This timely information is crucial for traders and analysts looking to benchmark MSTR's performance against Bitcoin effectively.
This dashboard compares Bitcoin performance versus MicroStrategy (MSTR) using daily price data to track how the stock has behaved relative to BTC since MicroStrategy began its Bitcoin treasury strategy in the second half of 2020. It shows cumulative and rolling returns across multiple time windows, helping visualize periods when MSTR amplifies or lags Bitcoin moves. The analysis includes annual returns and sliding-window comparisons to evaluate changing sensitivity through different market regimes. Data is updated with recent market prices and presented for fast, side-by-side benchmarking. Use it to understand the BTC–MSTR relationship, relative performance and risk across time horizons.