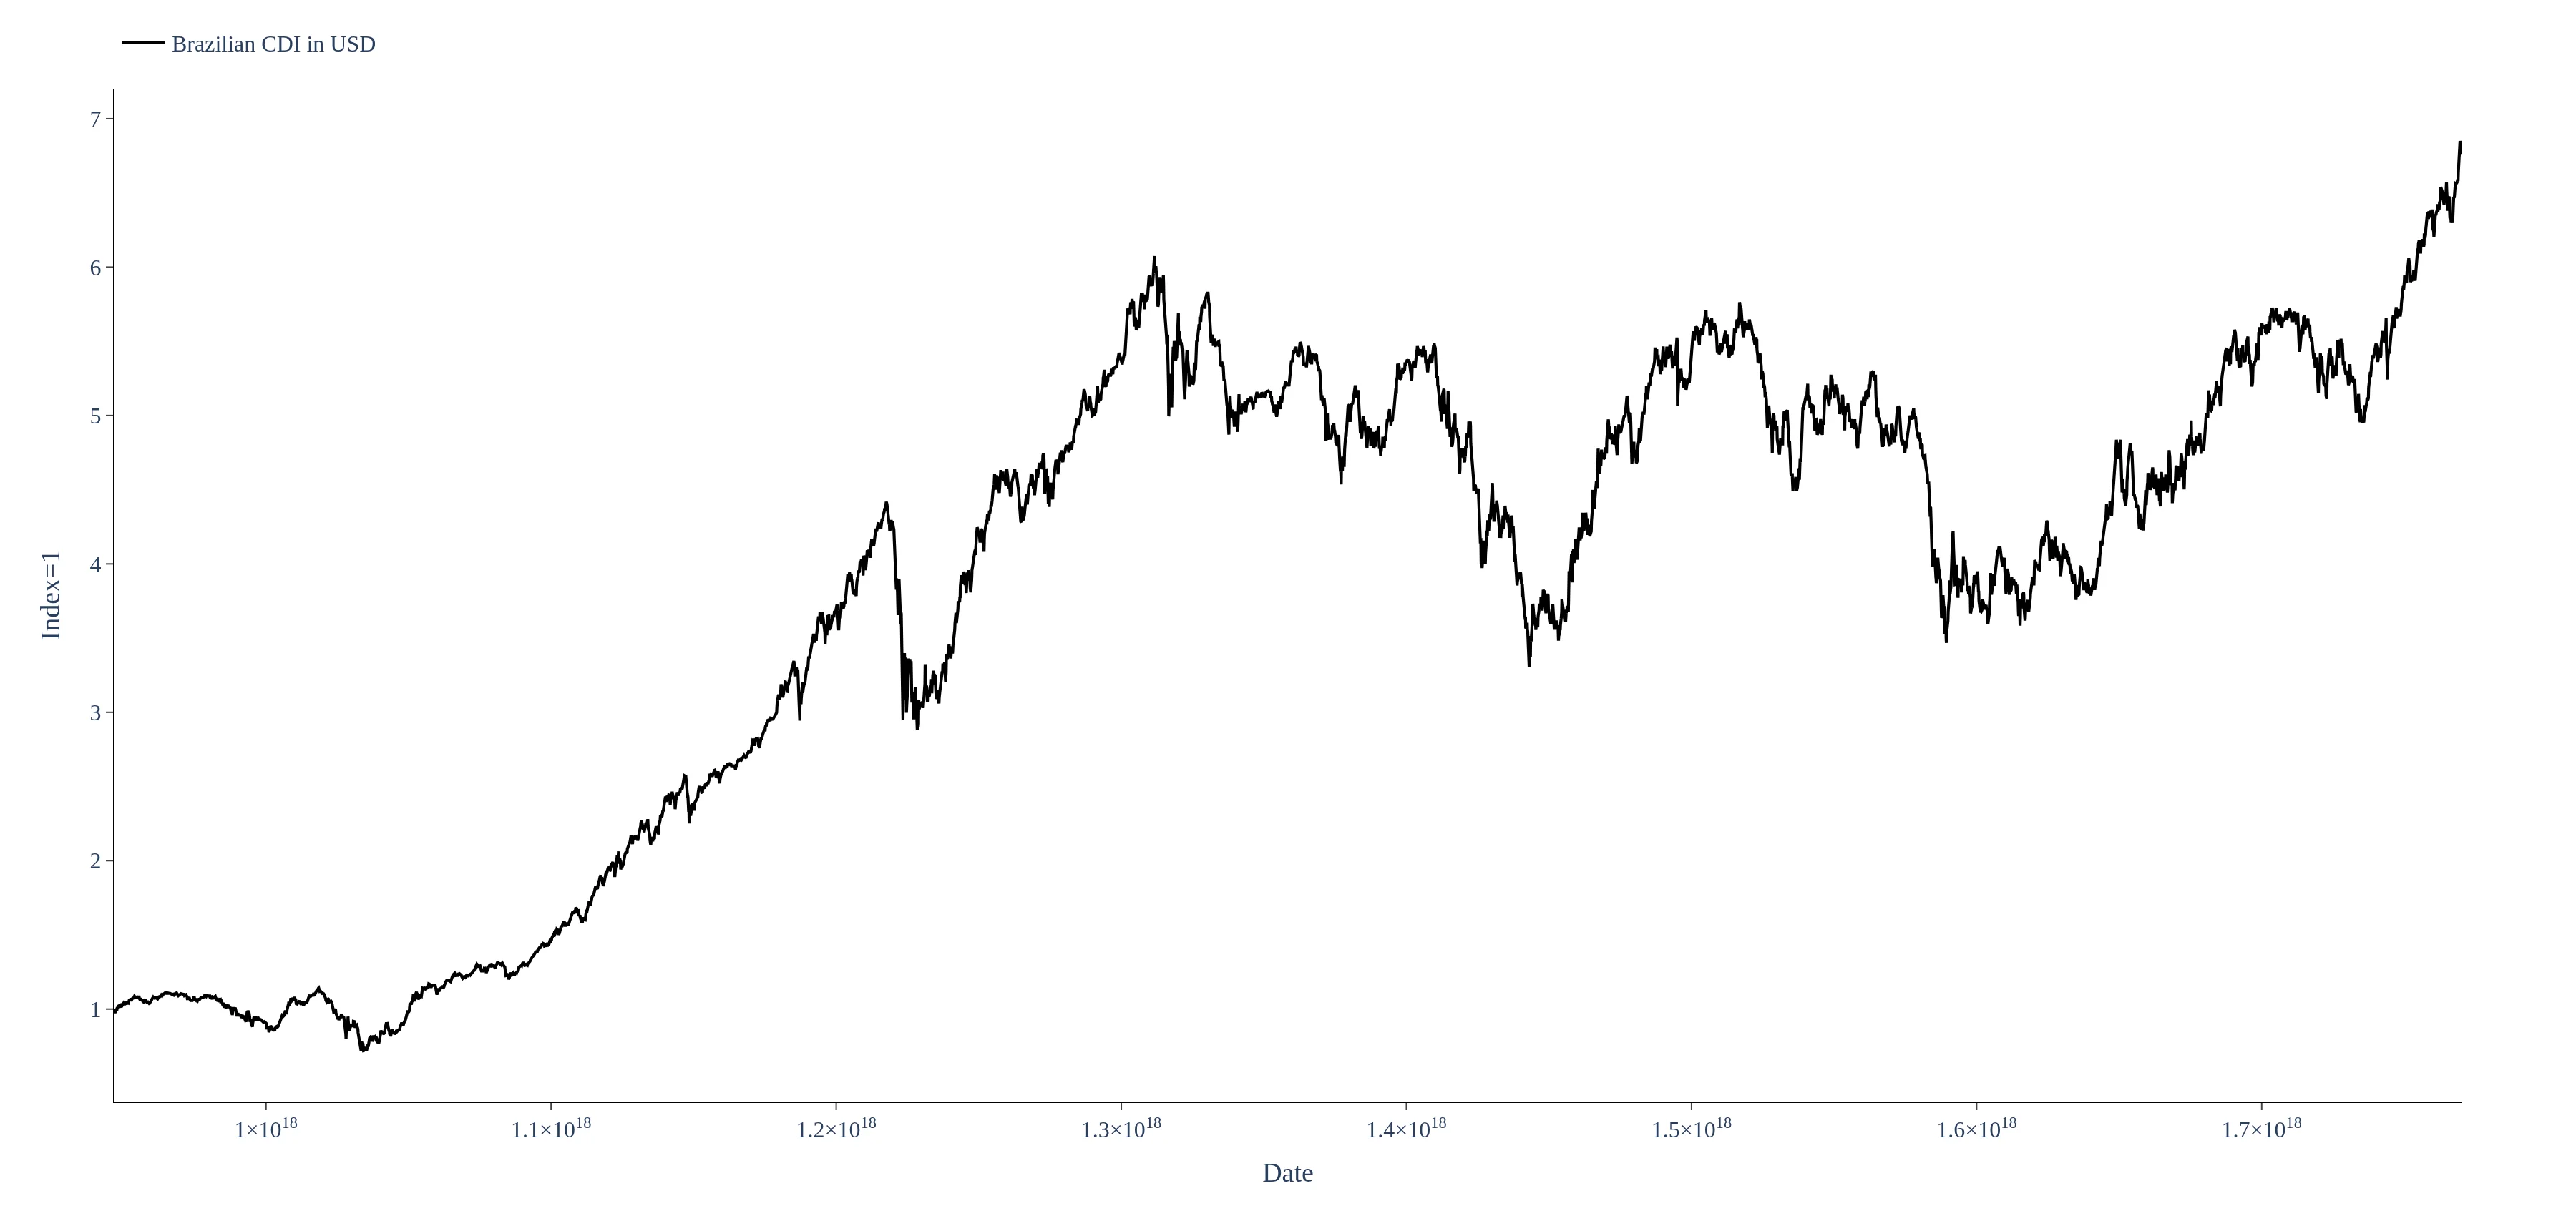
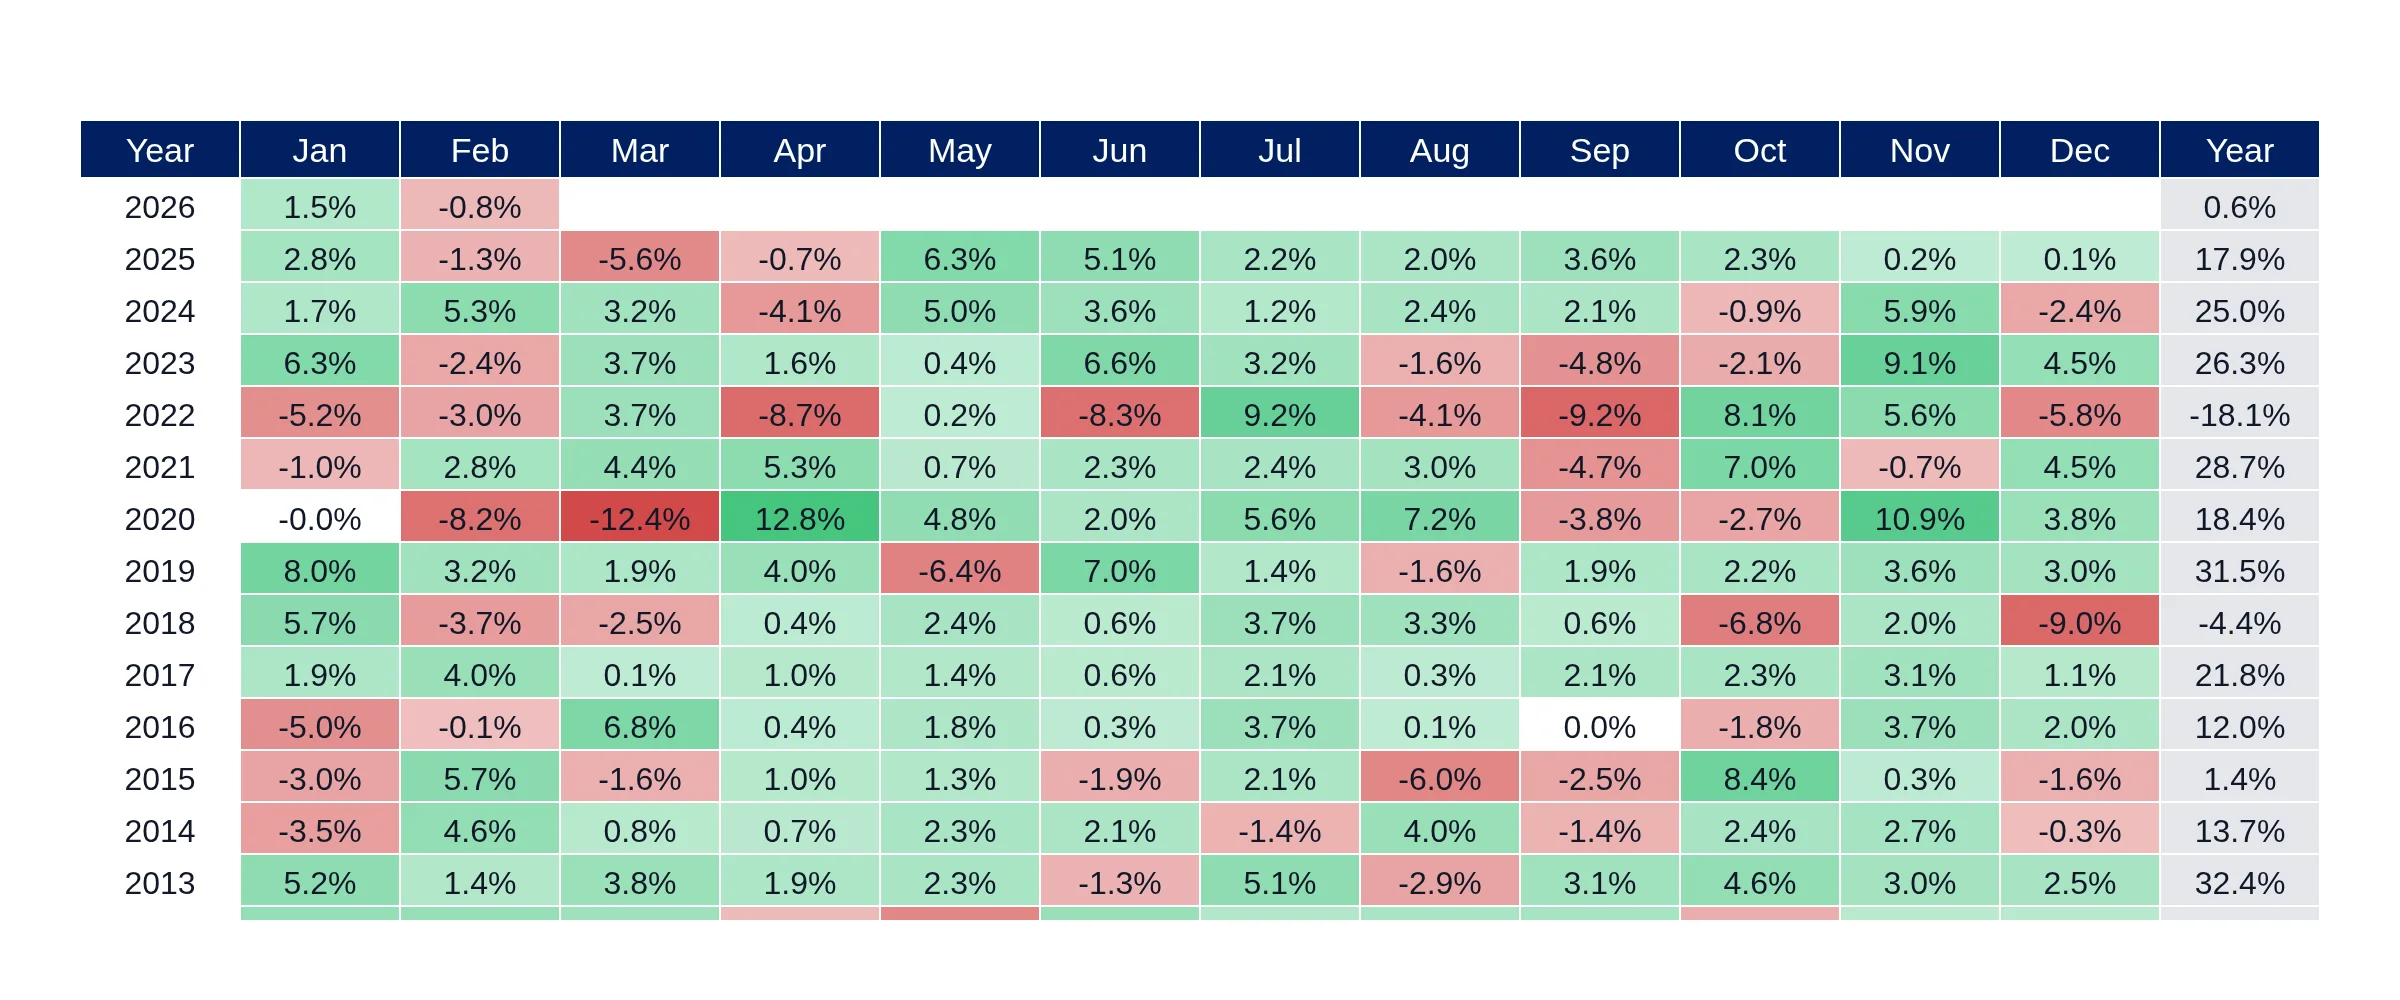
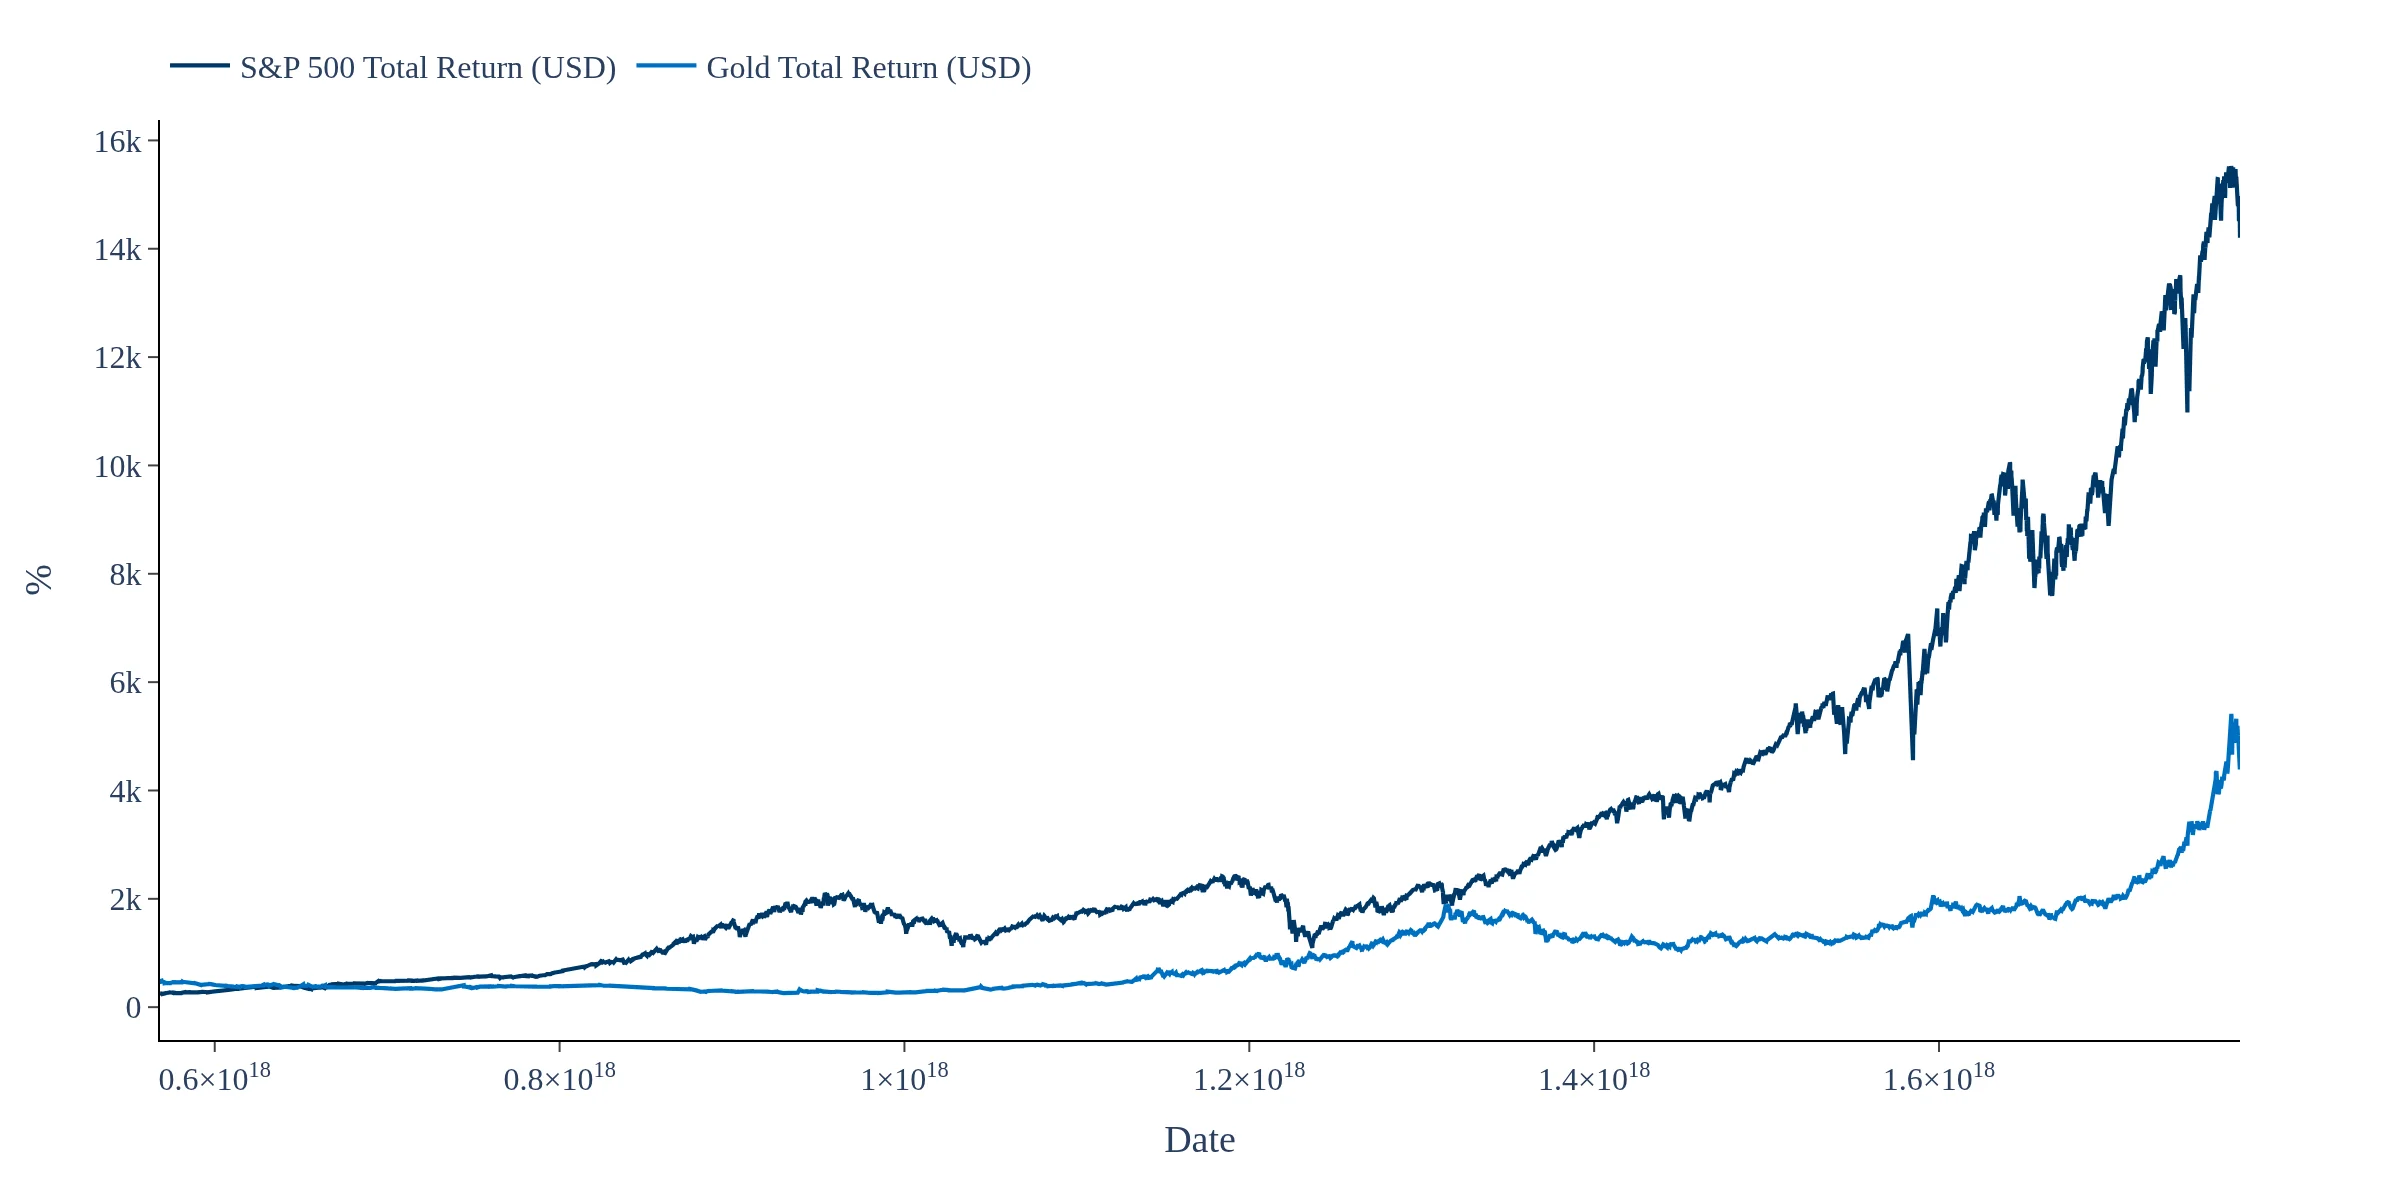
Compare the cumulative performance of Brazilian CDI converted to US dollars with the S&P 500 Total Return Index.
The dashboard allows you to compare the cumulative performance of the Brazilian CDI converted to US dollars against the S&P 500 Total Return Index. By analyzing historical data, you can see how these two USD-denominated investments have performed over time, taking into account the daily CDI rate and reinvested dividends.
The Brazilian CDI is compounded from the daily CDI rate in Brazilian reais and converted into US dollars using the USD/BRL exchange rate. This methodology ensures an accurate comparison of the Brazilian CDI and the S&P 500 Total Return Index over their common history.
Yes, the dashboard features a start-date slider that allows you to normalize both the Brazilian CDI and S&P 500 series to the same base. This enables you to compare their cumulative performance from any selected date, providing insights into investment strategies over different time frames.
This screen compares two USD-denominated total-return investments over their common history. Brazilian CDI is compounded from the daily CDI rate in Brazilian reais and converted into US dollars using the USD/BRL exchange rate. The S&P 500 series includes reinvested dividends. Use the start-date slider to normalize both series to the same base and compare their cumulative performance from any selected date.