This dashboard provides a comprehensive analysis of S&P 500 total returns by year using daily total return data, which includes both price changes and reinvested dividends. You can view annual returns summarized in tables and charts, allowing for easy comparison across different market cycles.
The dashboard breaks down monthly returns by calendar year, highlighting seasonality and the distribution of gains and losses. This allows investors to identify consistent trends and drawdowns throughout the year, providing valuable insights into the month-by-month behavior of the S&P 500 total return index.
The data on this dashboard is updated with the latest observations, ensuring that you have access to the most current S&P 500 total return performance metrics. This timely information is crucial for making informed investment decisions based on long-term equity returns.
This dashboard tracks S&P 500 total return performance by year using daily total return data to capture both price changes and reinvested dividends. It summarizes annual returns in tables and charts to compare long-run performance across market cycles. The dashboard also breaks down monthly returns by calendar year to highlight seasonality, consistency and the distribution of gains and losses. Data is updated with the latest observations and organized for fast historical comparison and context. Use it to study long-term equity returns, drawdowns across years and the month-by-month behavior of the S&P 500 total return index.
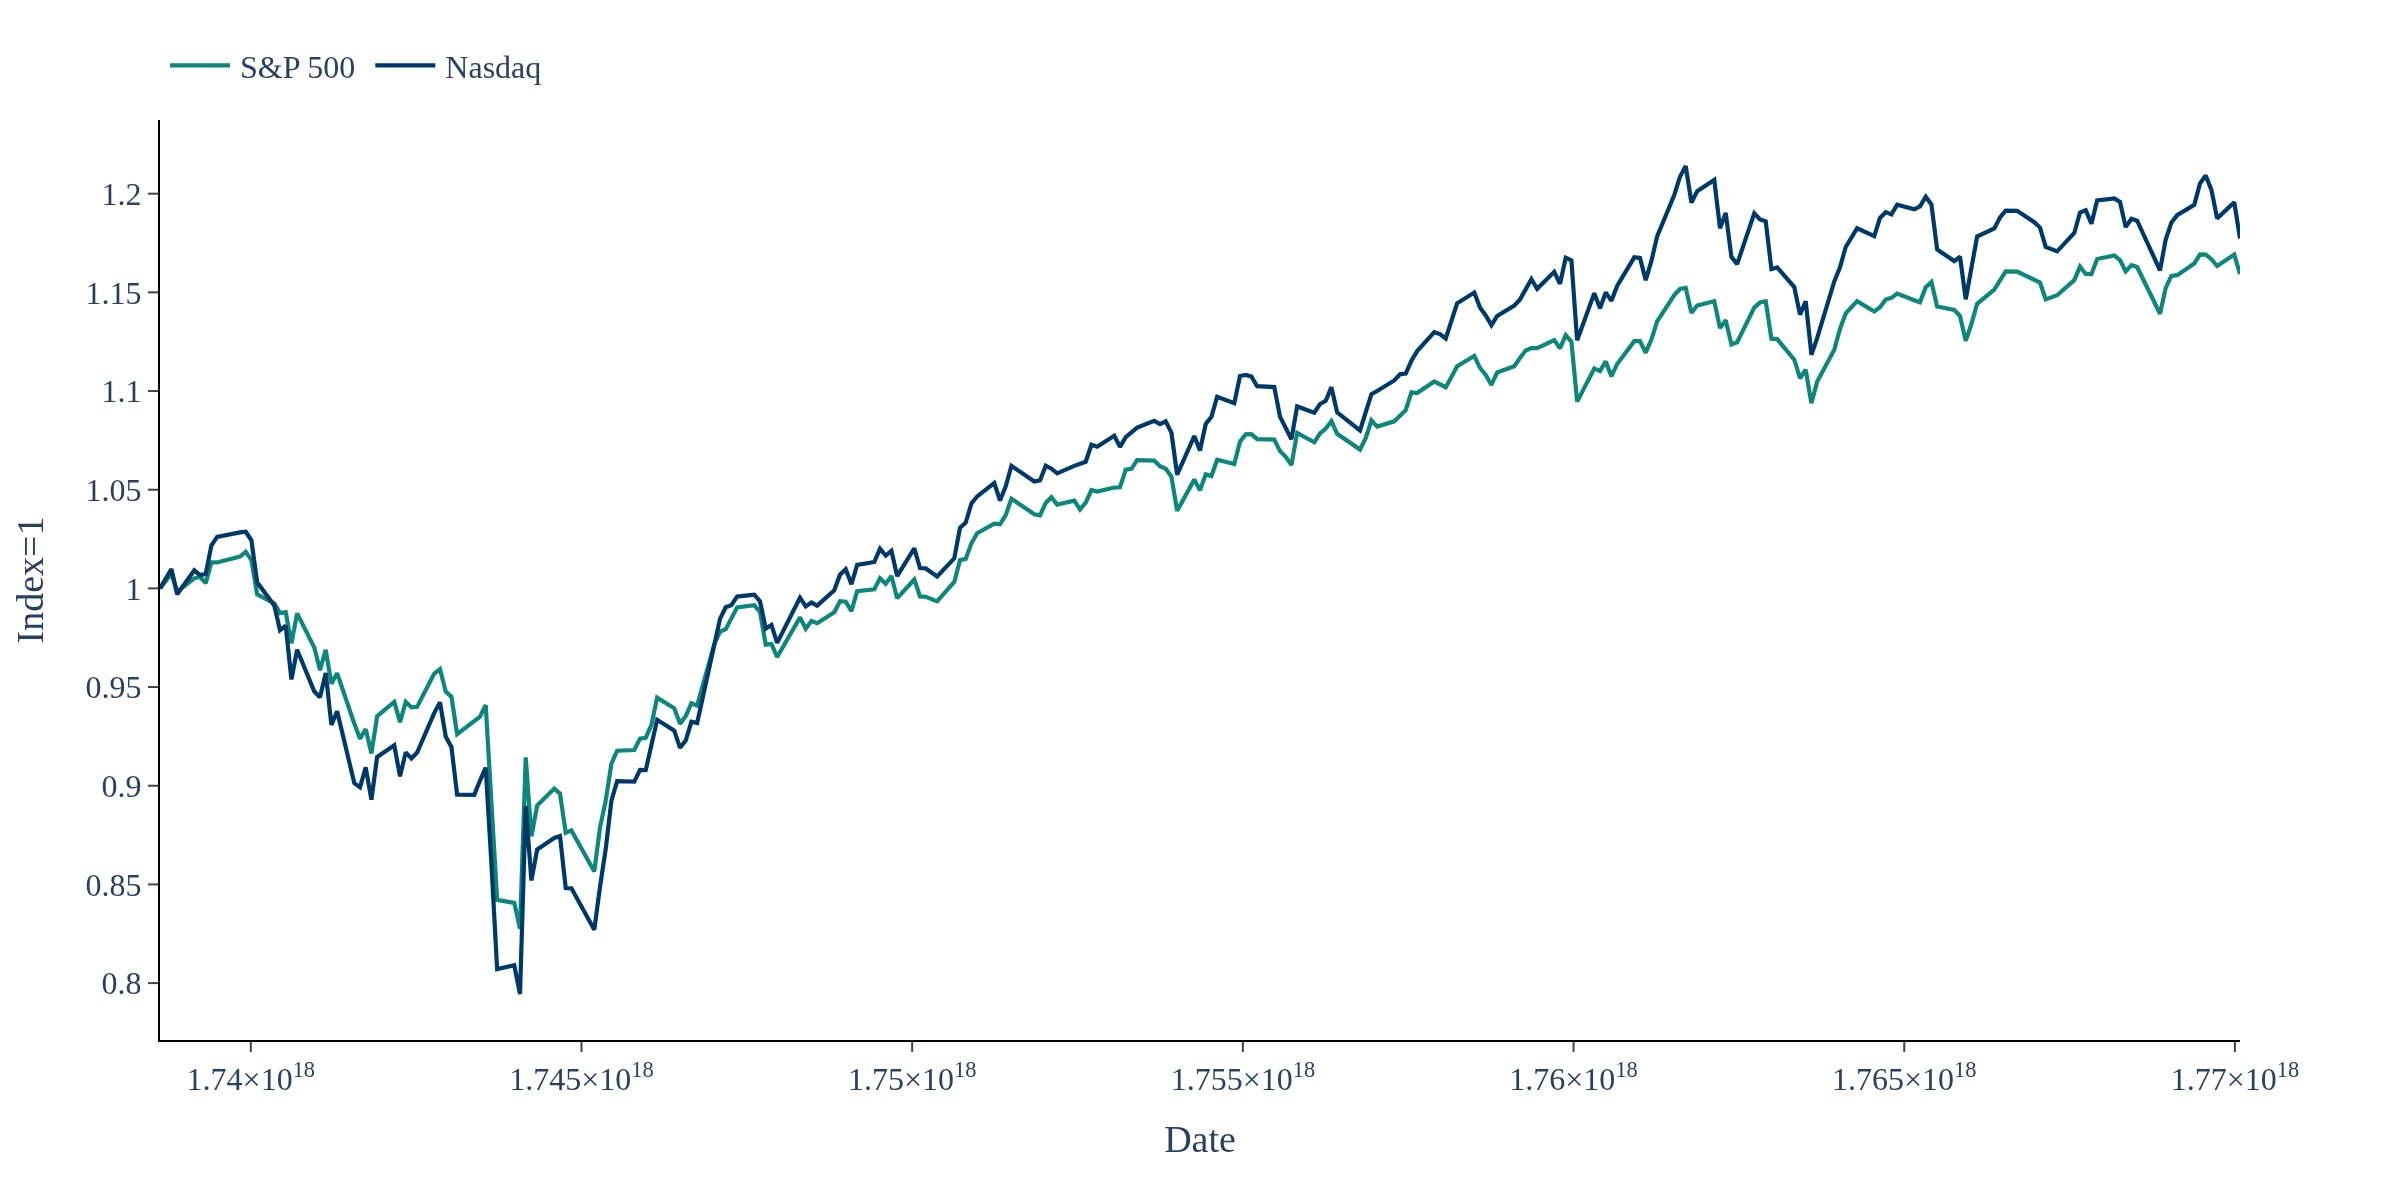
Track how are US Equities are behaving
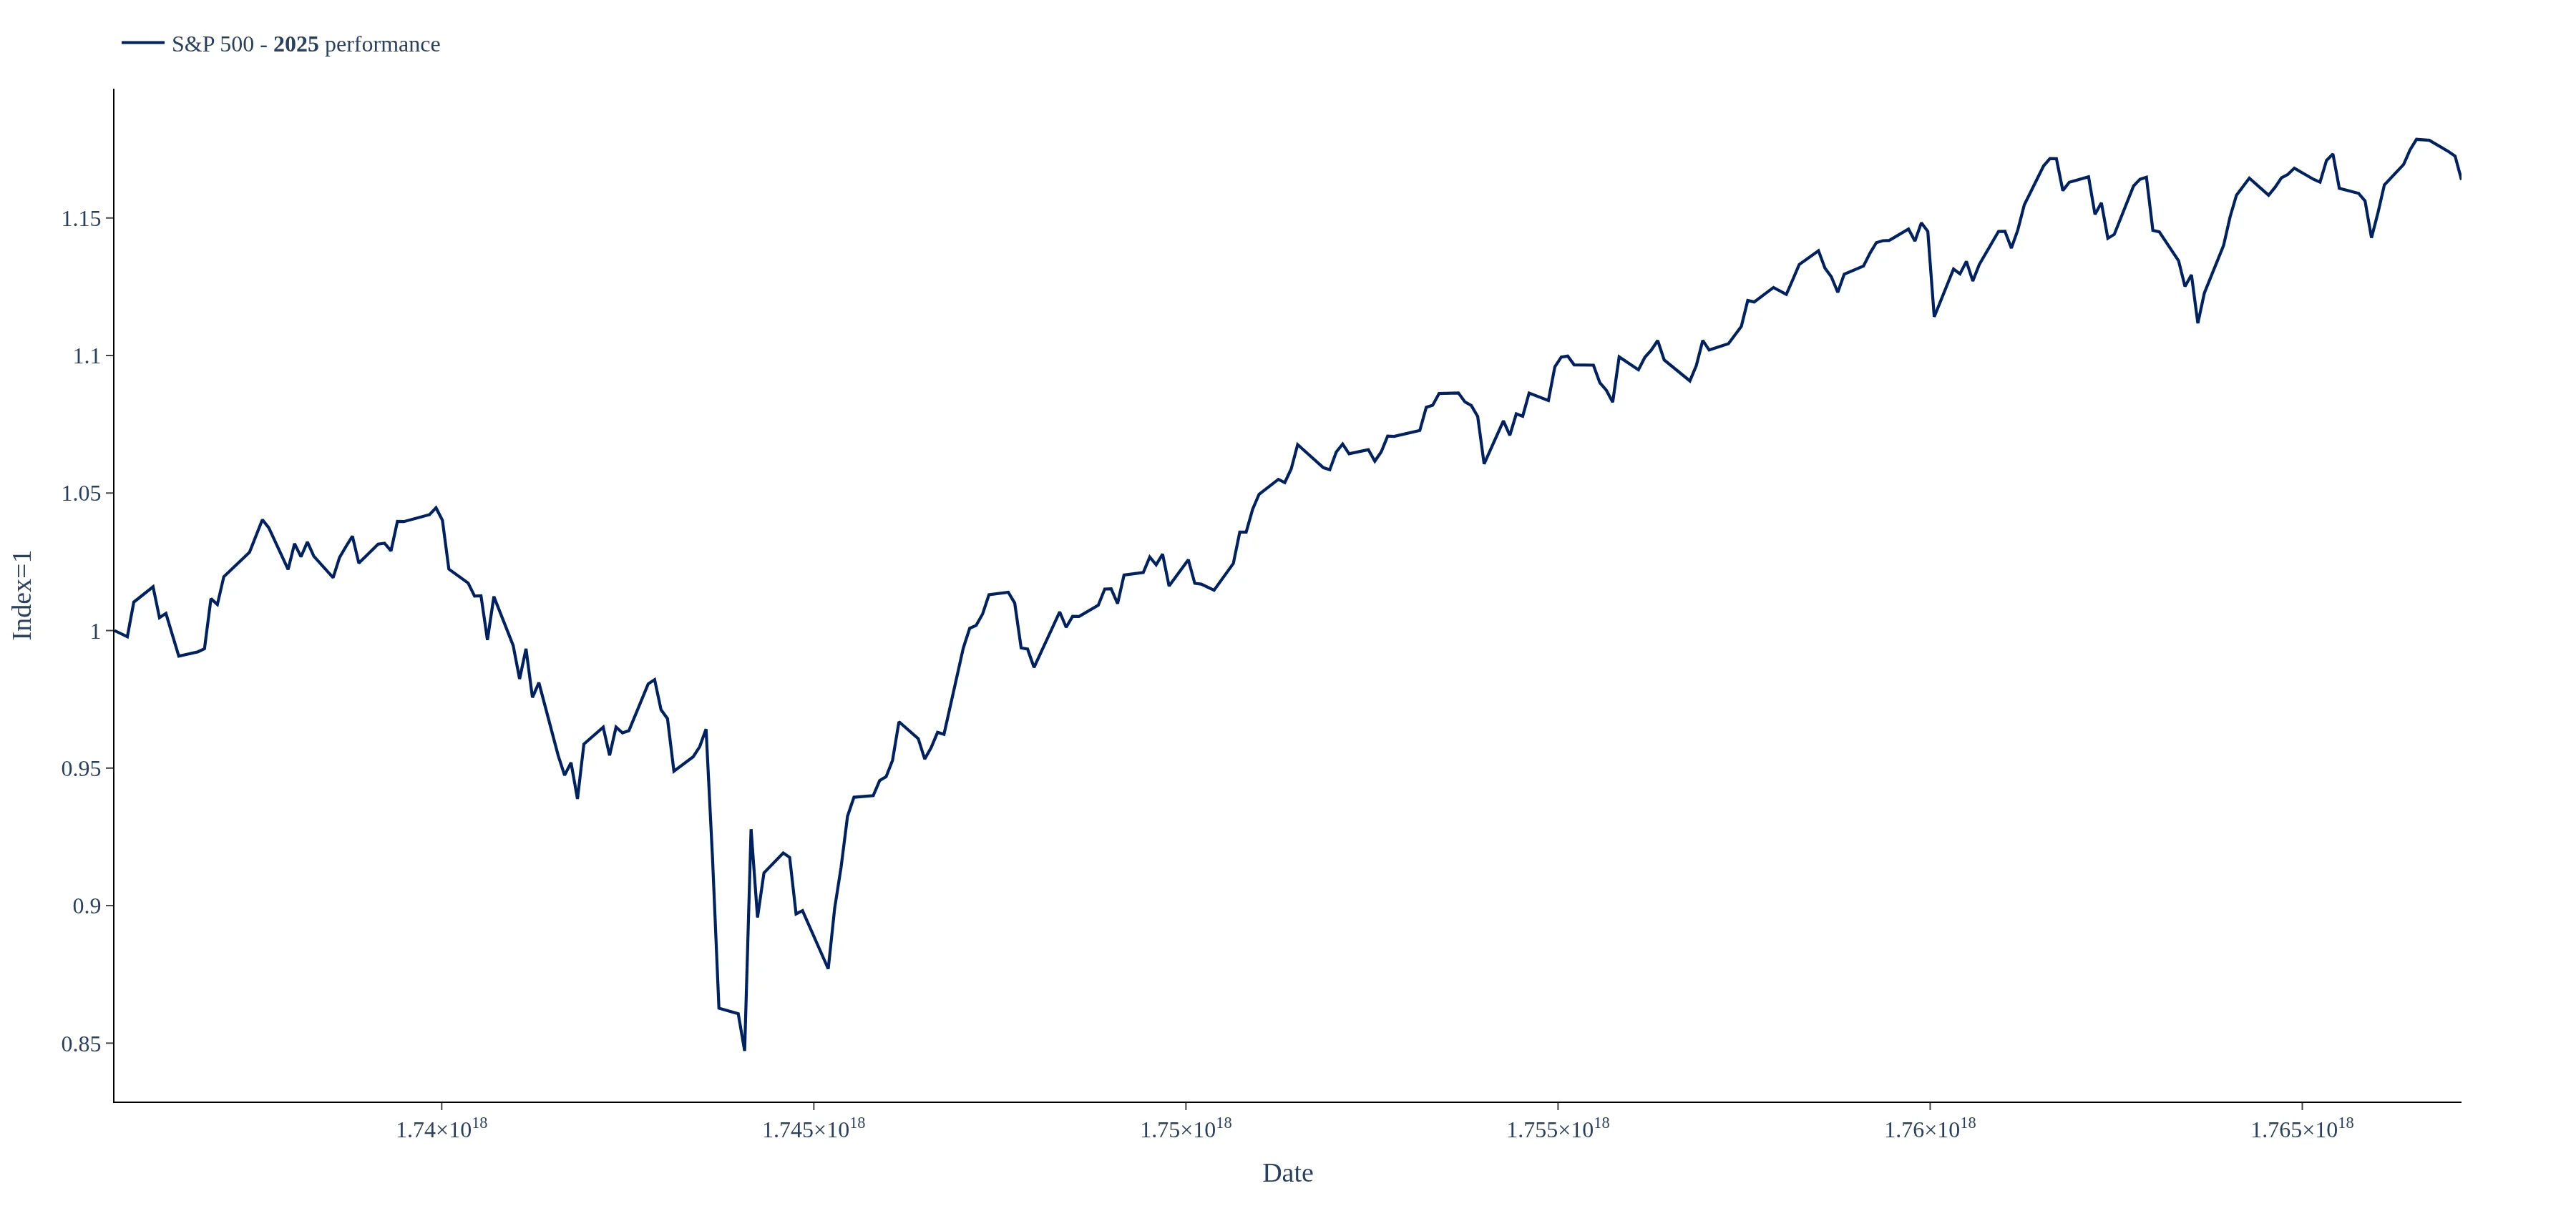
Check out the performance for the S&P 500 throughout all years since 1983
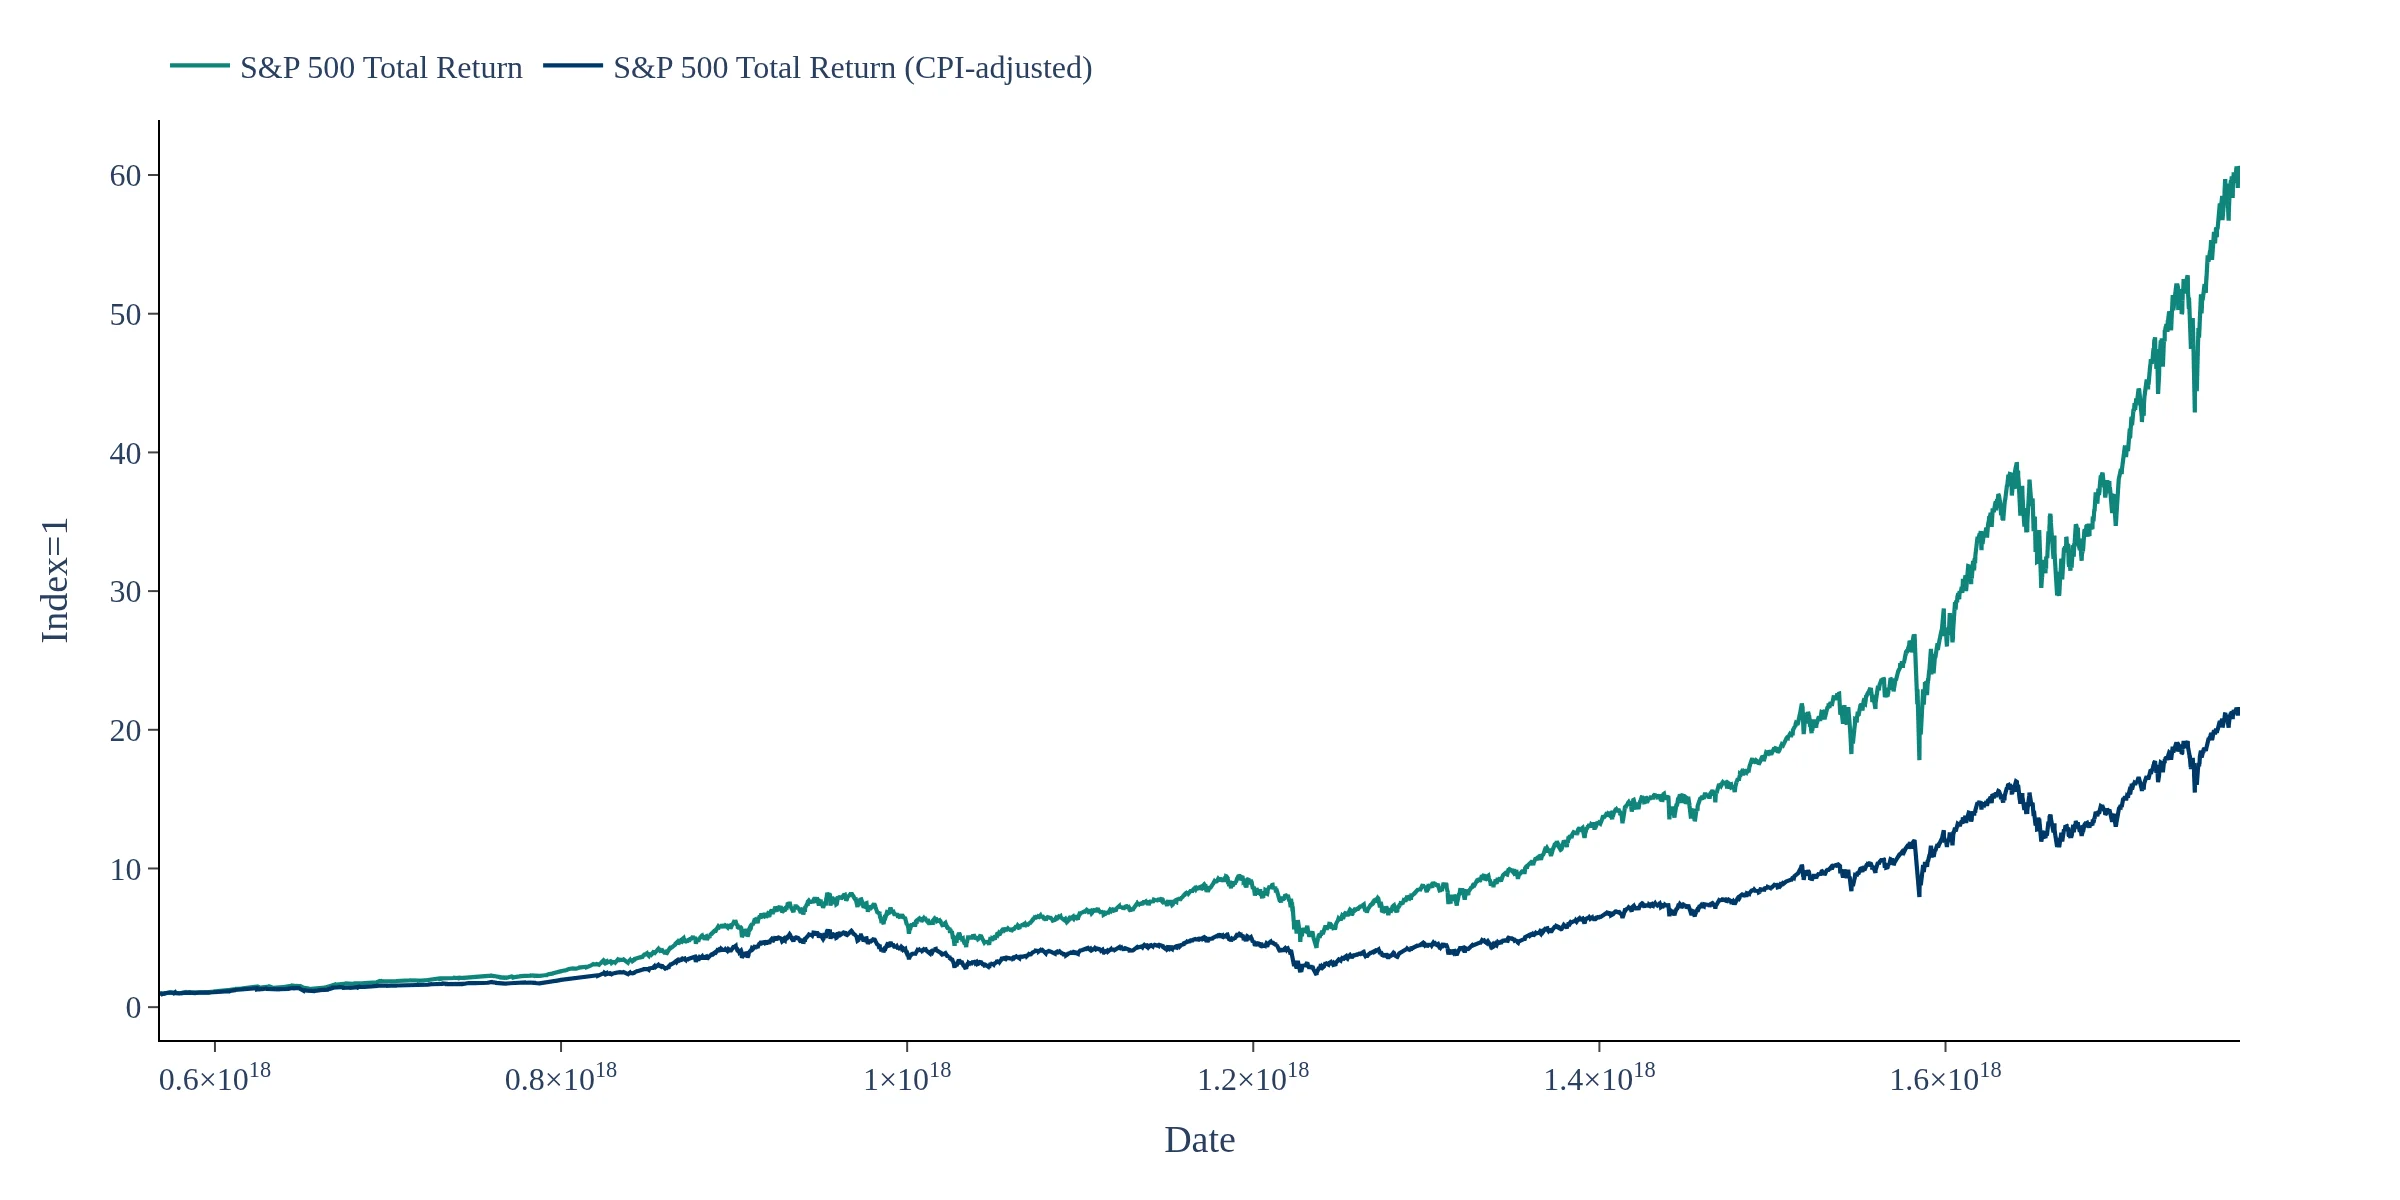
US S&P 500 Total Return, CPI-adjusted. Get real insight into how purchasing power is evolving in US Equities