The DXY Returns by Year dashboard provides a comprehensive summary of annual returns for the US Dollar Index (DXY) through detailed tables and charts. By examining these annual returns, traders and analysts can identify long-term trends and assess the dollar's performance against a basket of major currencies, including EUR, JPY, and GBP.
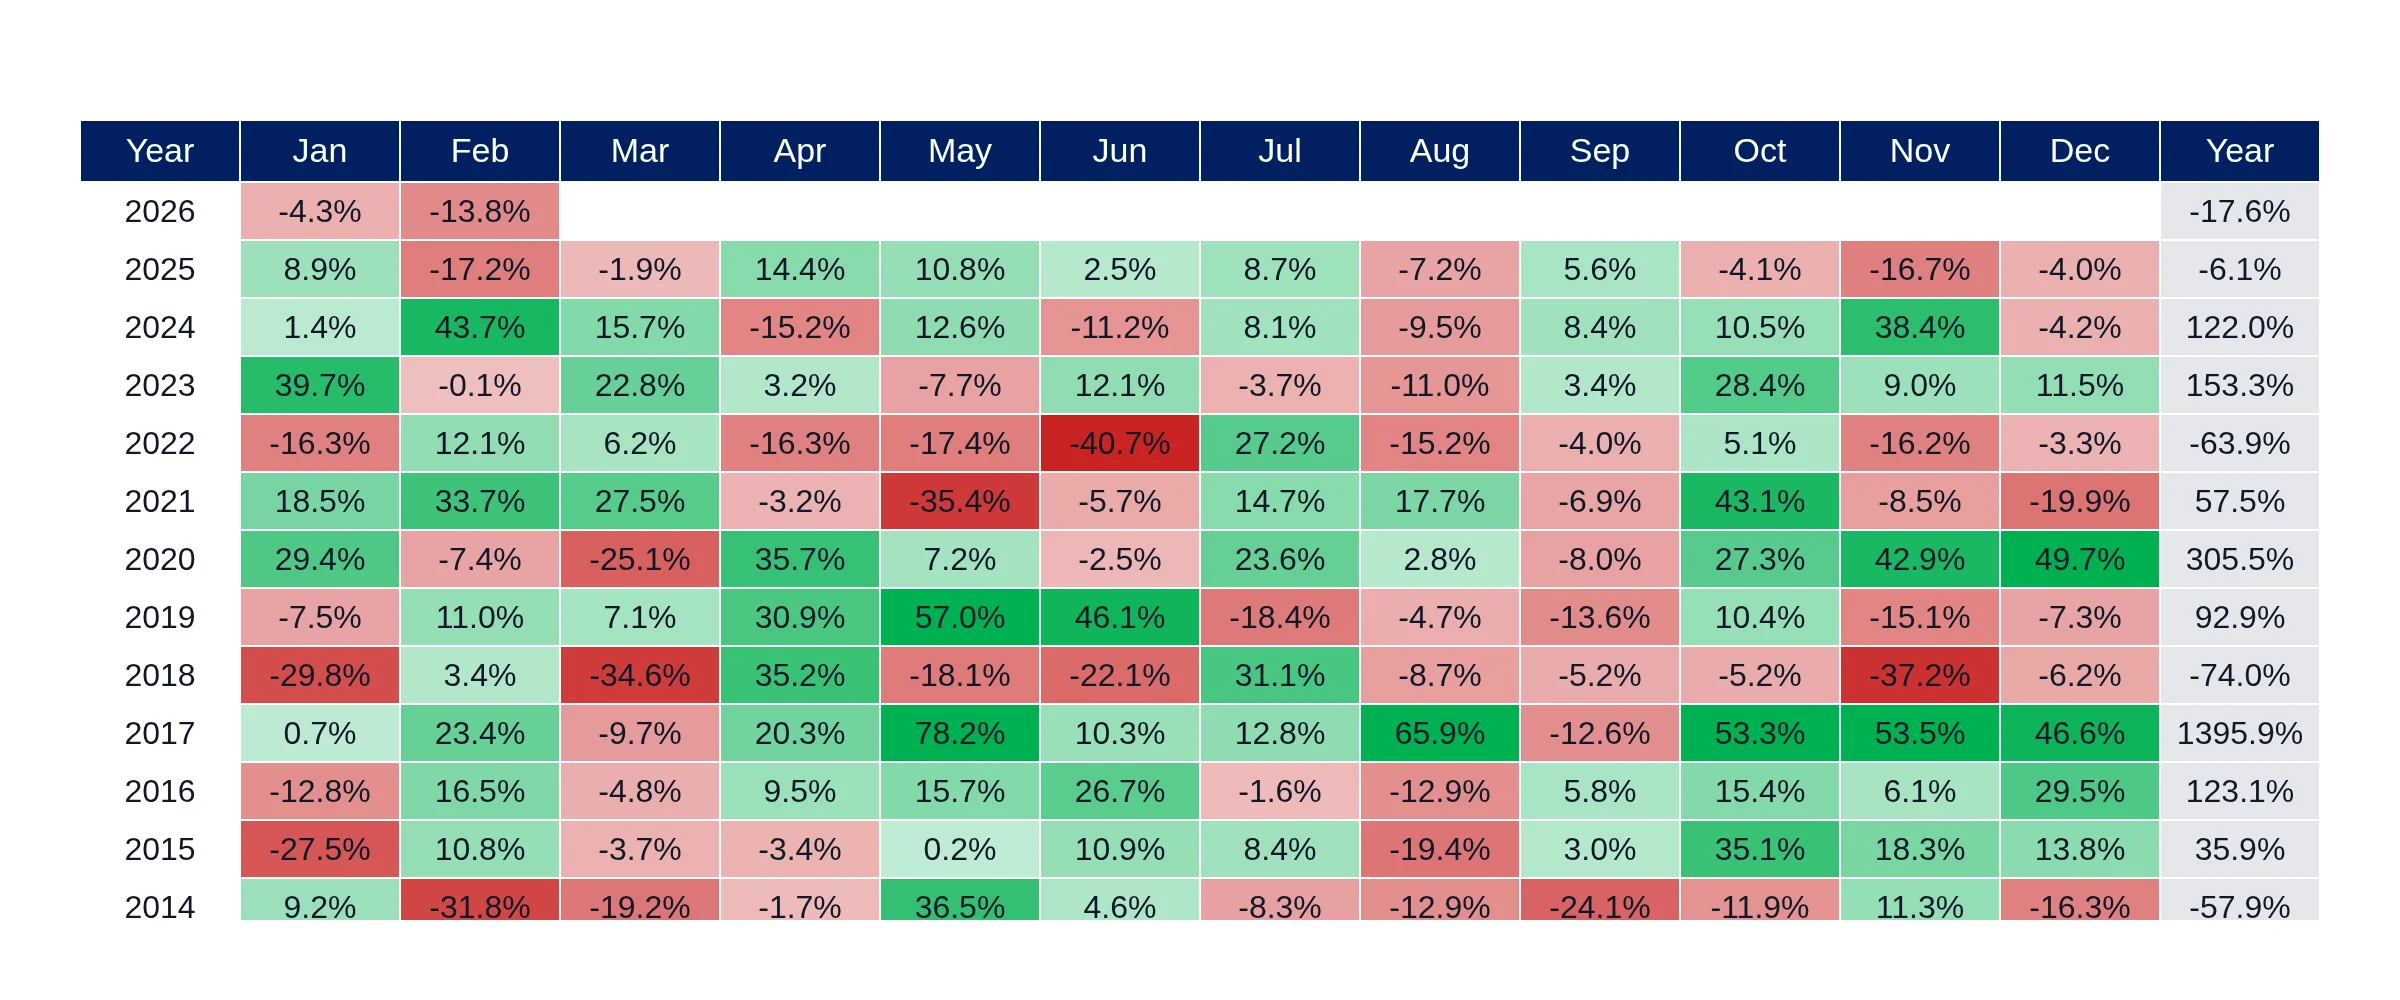
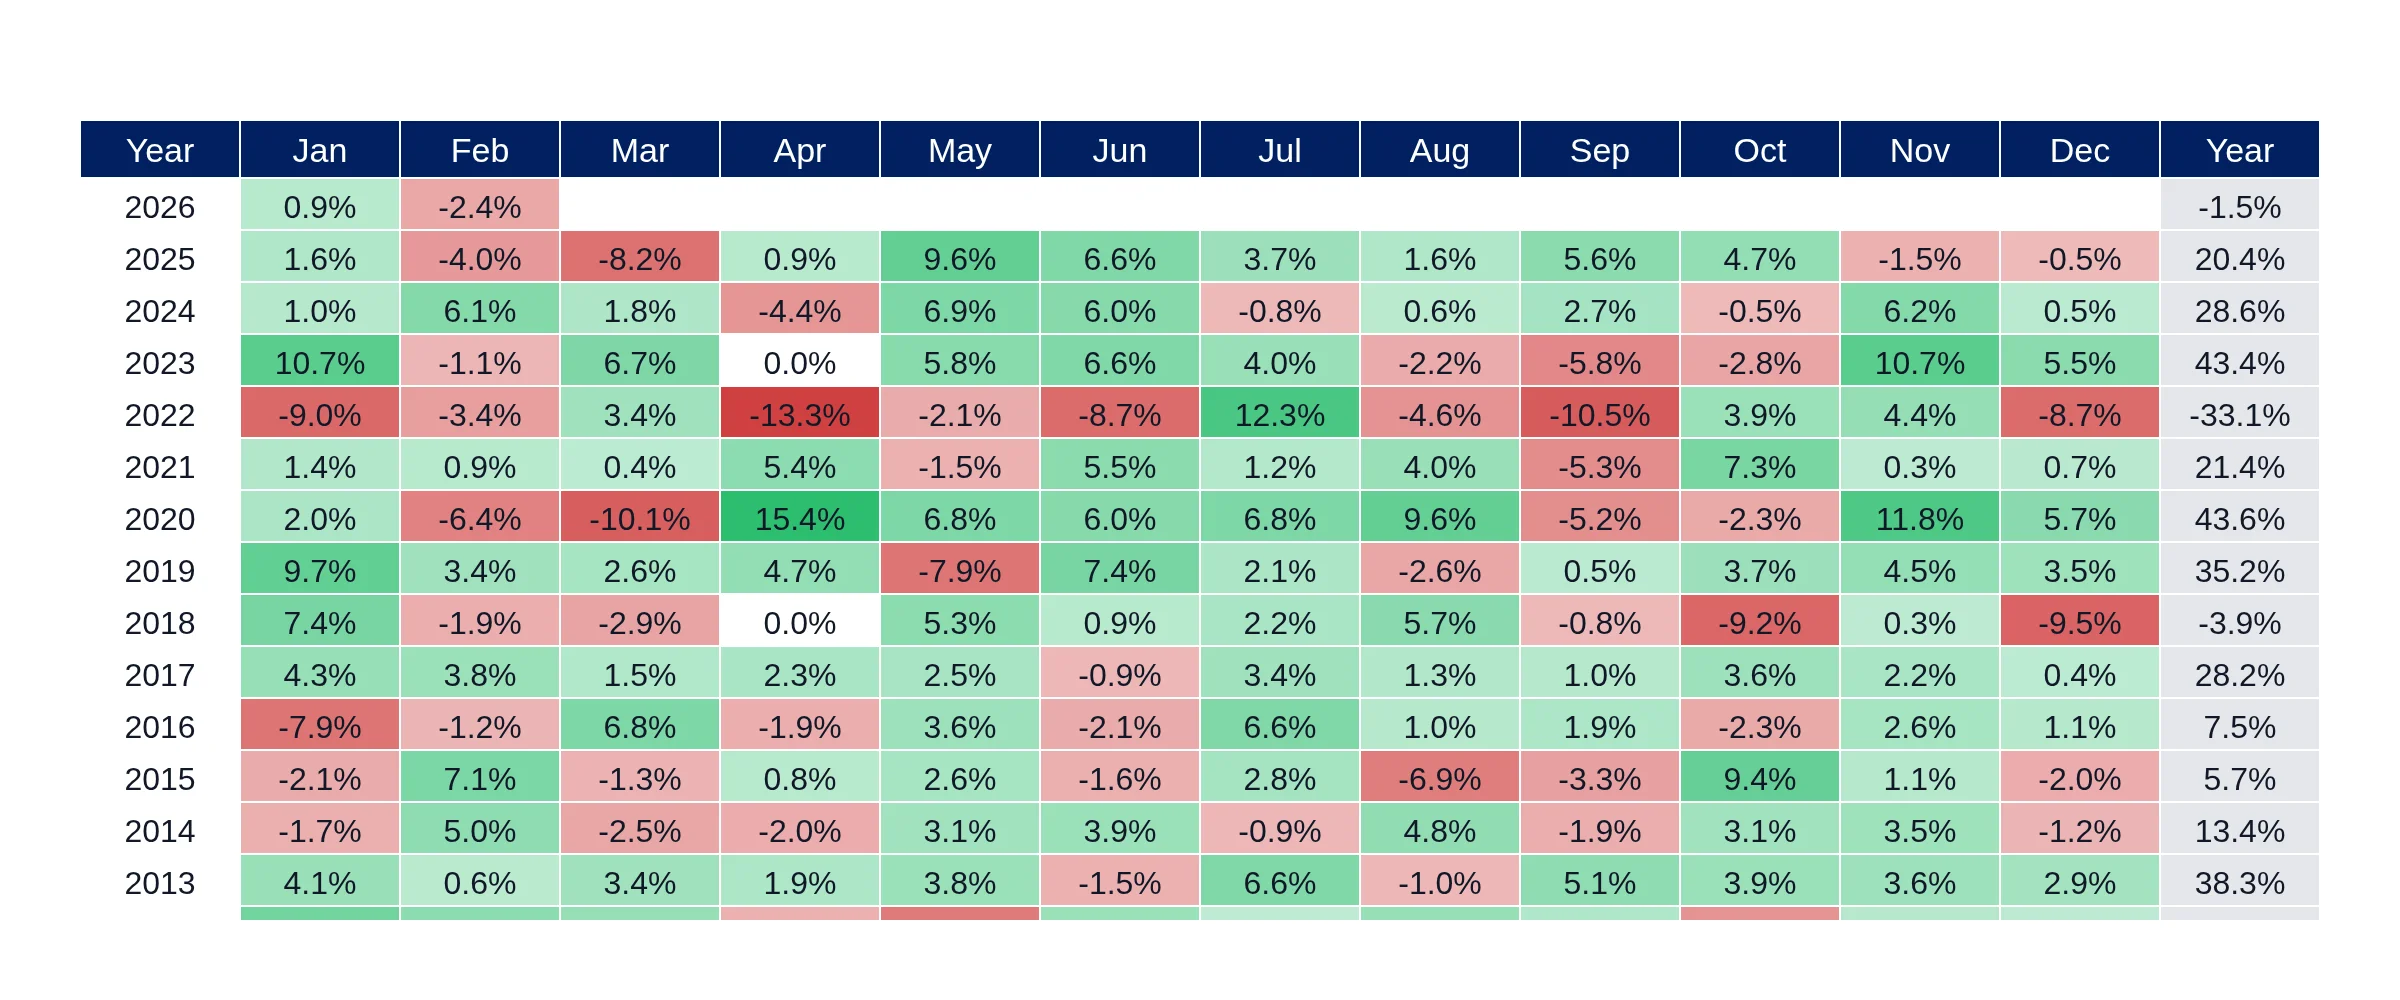
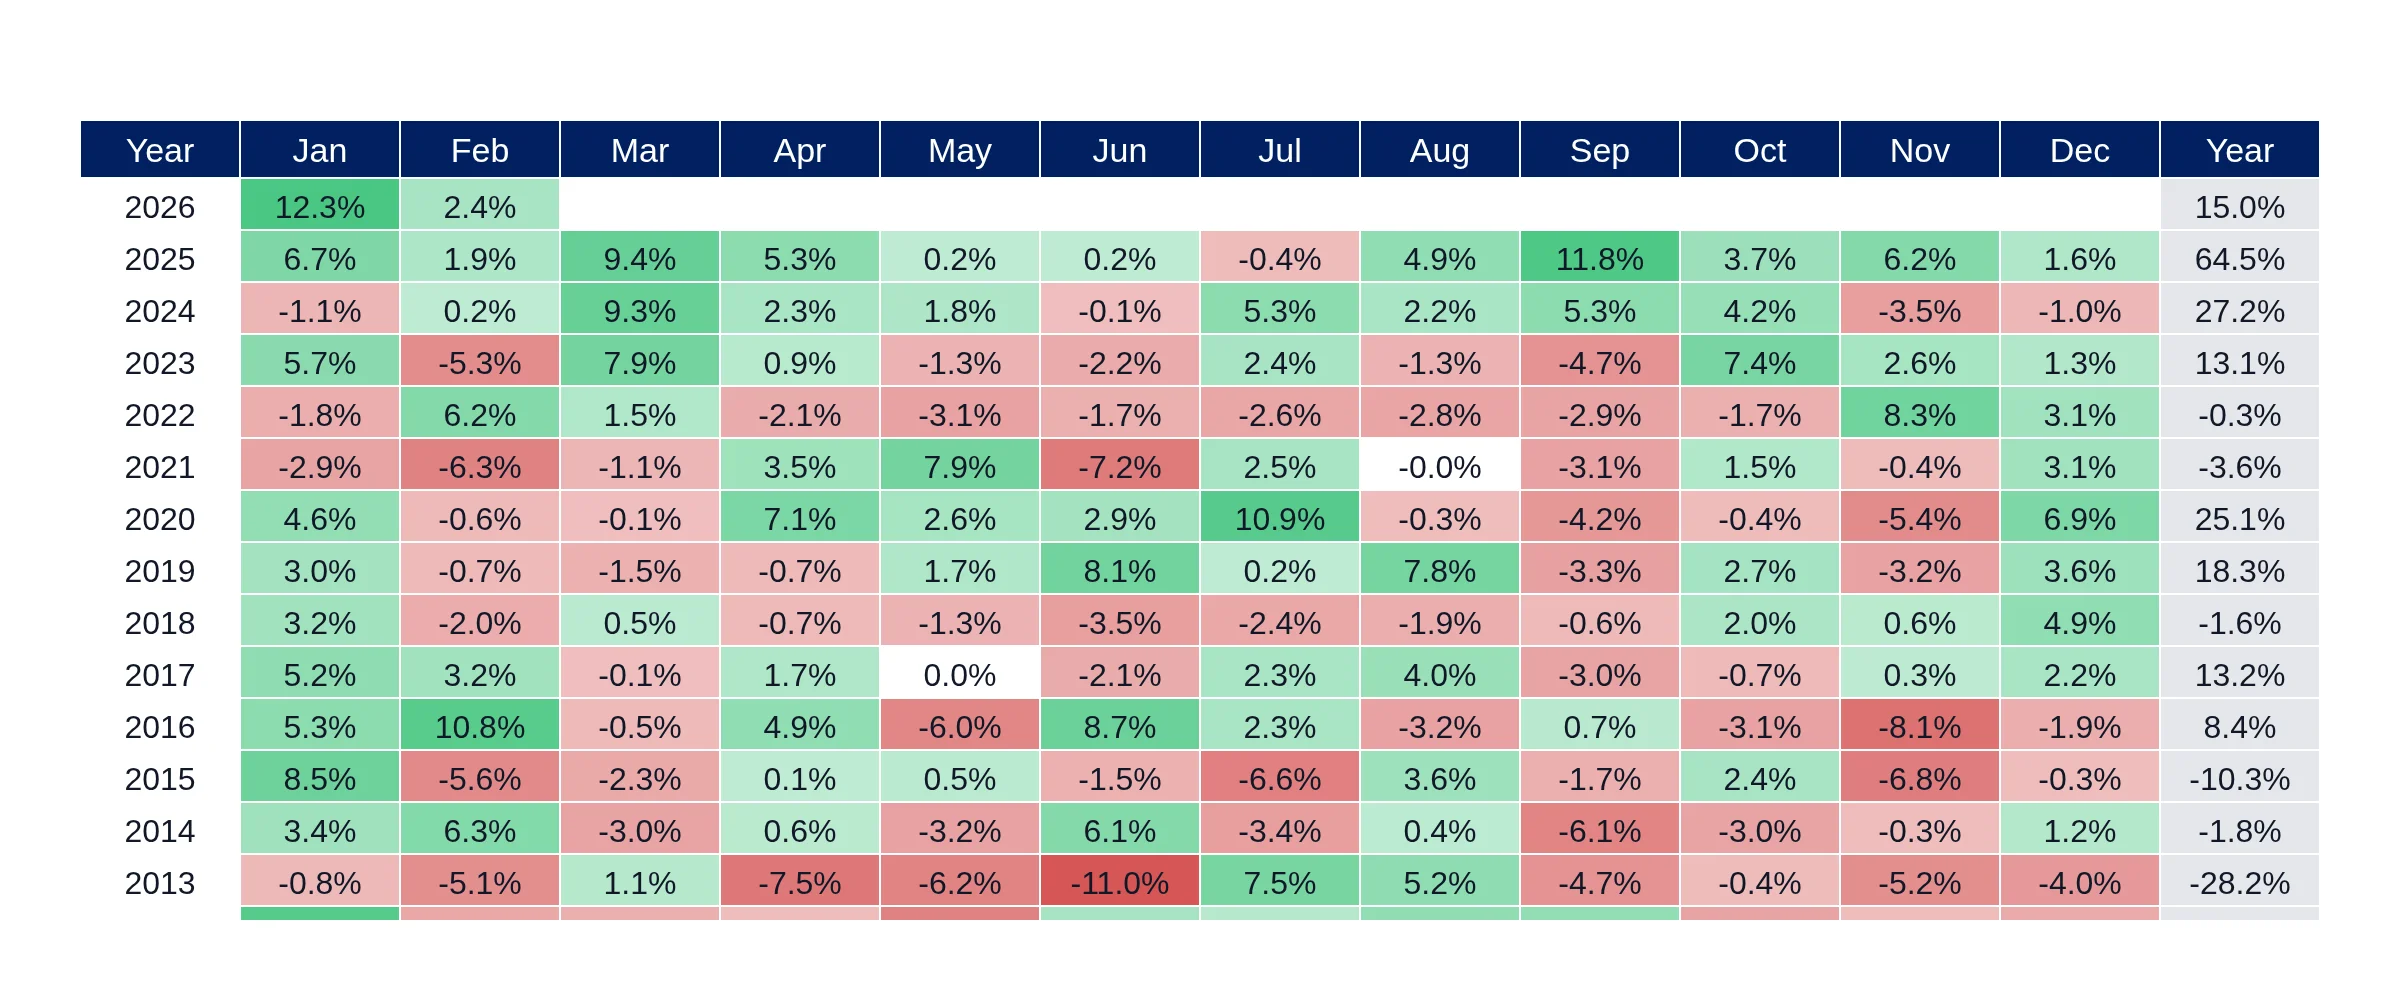
The monthly returns section of the DXY dashboard highlights the seasonality and distribution of gains and losses throughout each calendar year. This data allows investors to pinpoint specific months where the dollar has historically performed well or poorly, which can inform trading strategies and risk management.
The DXY (US Dollar Index) dashboard tracks historical dollar performance, allowing users to compare USD strength across different macroeconomic cycles. By analyzing both annual and monthly returns, investors can gain insights into major drawdowns and the dollar's behavior relative to other currencies, aiding in informed investment decisions.
DXY US Dollar Index dashboard tracks historical dollar performance using daily index levels to compute annual and monthly returns and compare USD strength across macro cycles. It summarizes DXY annual returns in tables and charts, and breaks down monthly returns by calendar year to highlight seasonality and the distribution of gains and losses. The dashboard reflects the dollar’s value versus a basket of major currencies (EUR, JPY, GBP, CAD, SEK, CHF), updated with the latest observations for fast historical comparison and context. Use it to analyze long-run USD trends, major drawdowns, and month-by-month behavior of the Dollar Index (DXY)