Interactive chart showing historical gold annual returns by year; data can be downloaded for further analysis.
The Gold Annual Returns by Year dashboard provides an interactive chart that displays historical gold performance, allowing you to analyze yearly returns easily. You can compare the percentage performance of gold from one year to the next, using data based on the change in the U.S. dollar price of gold.
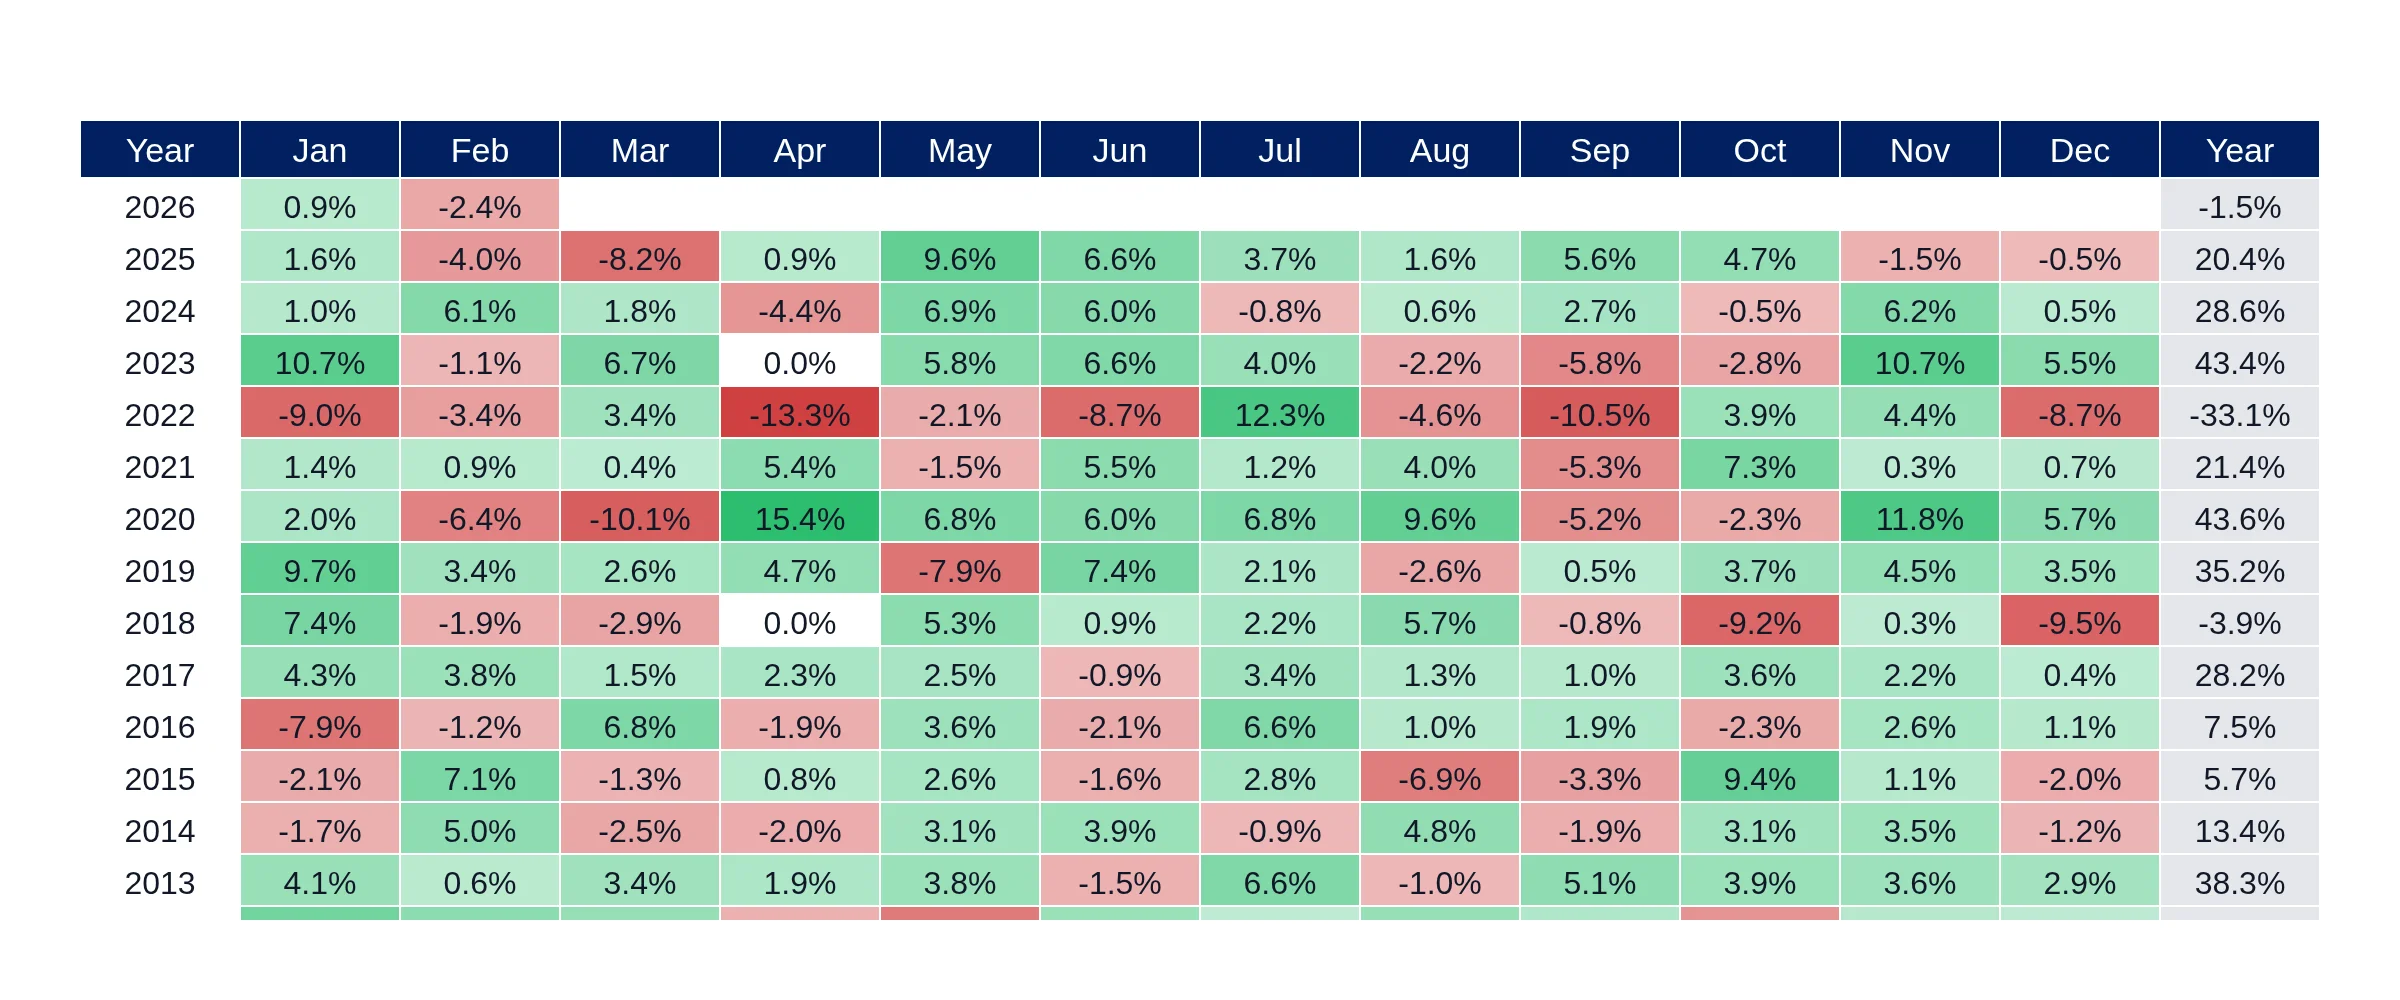
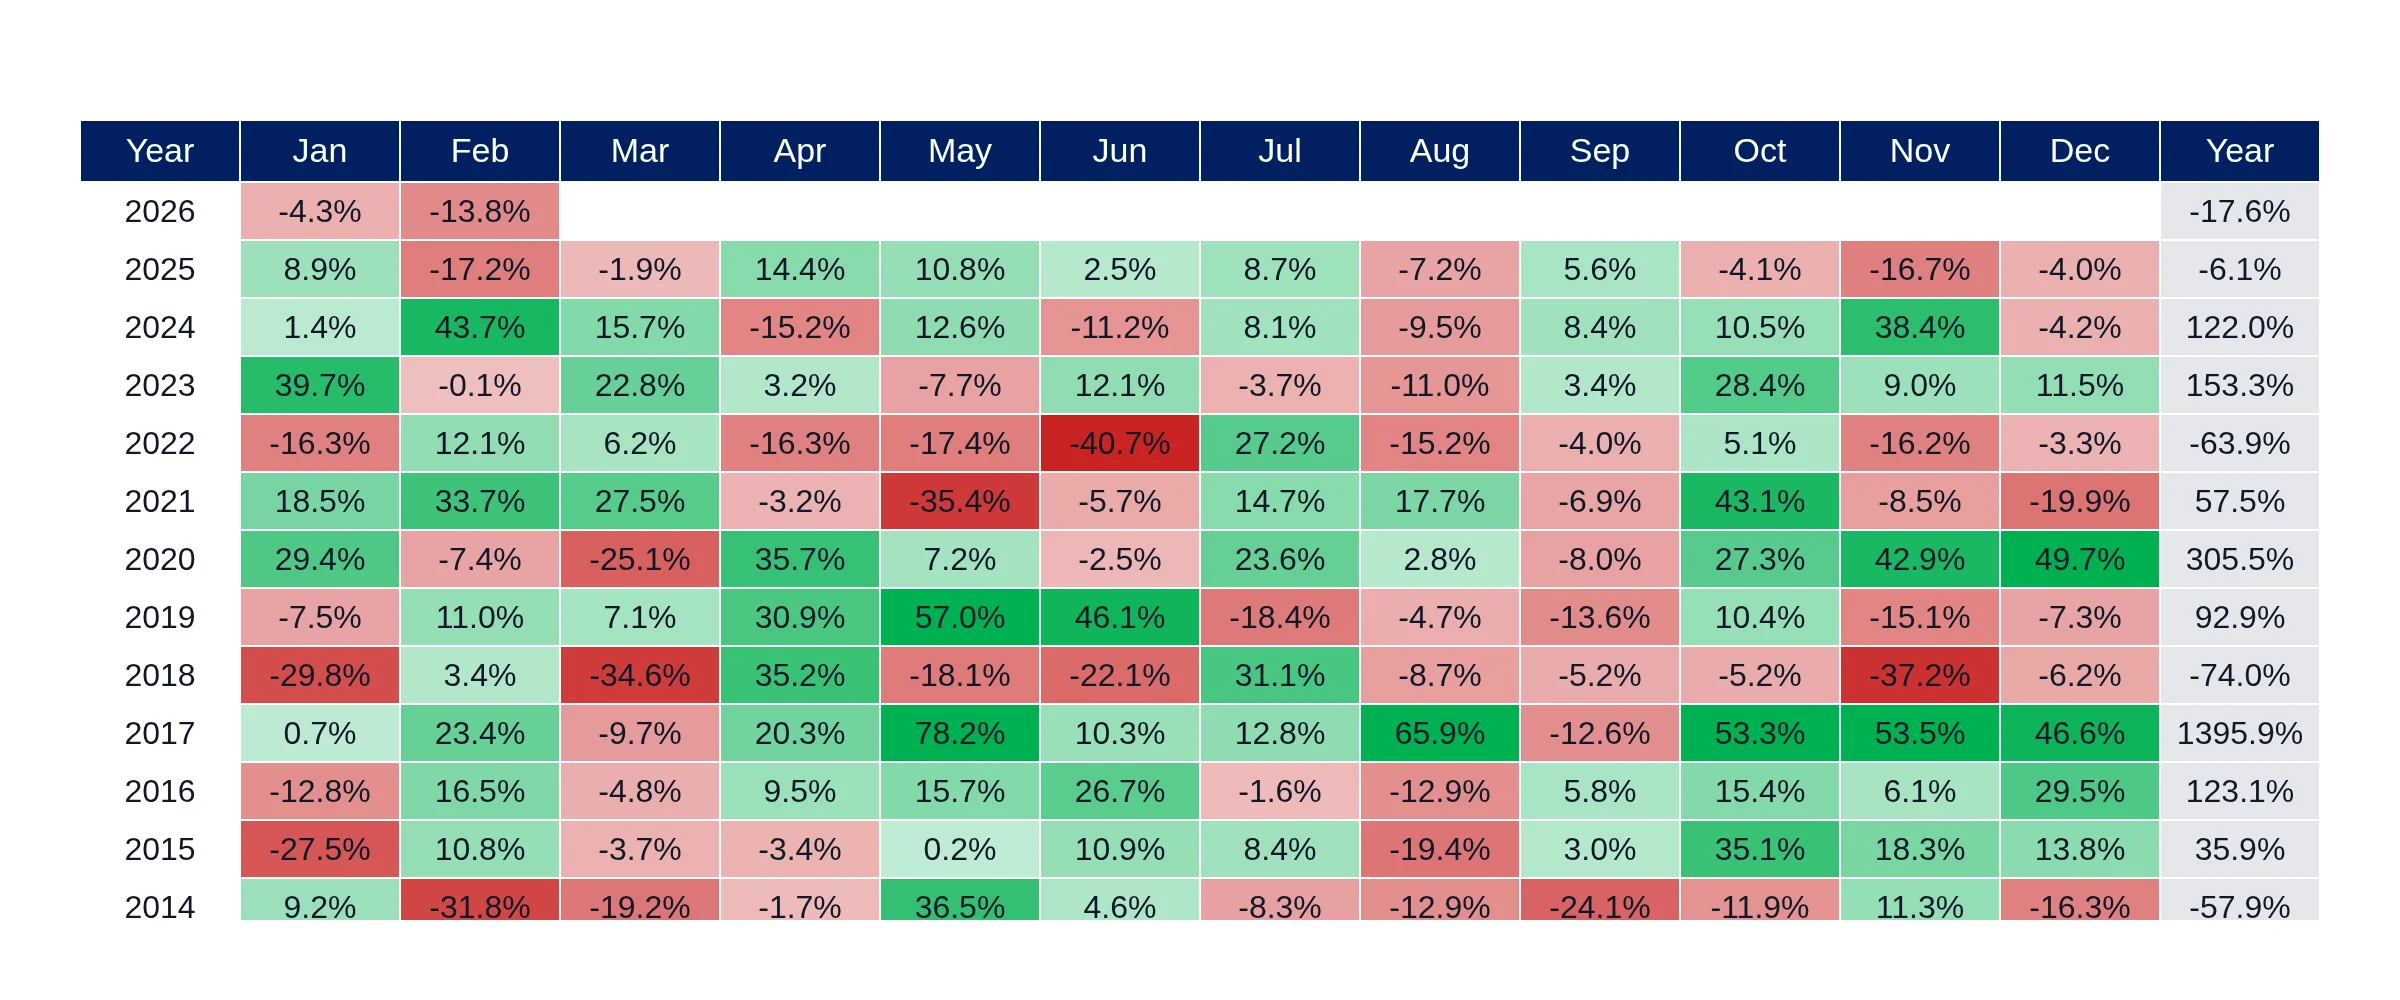
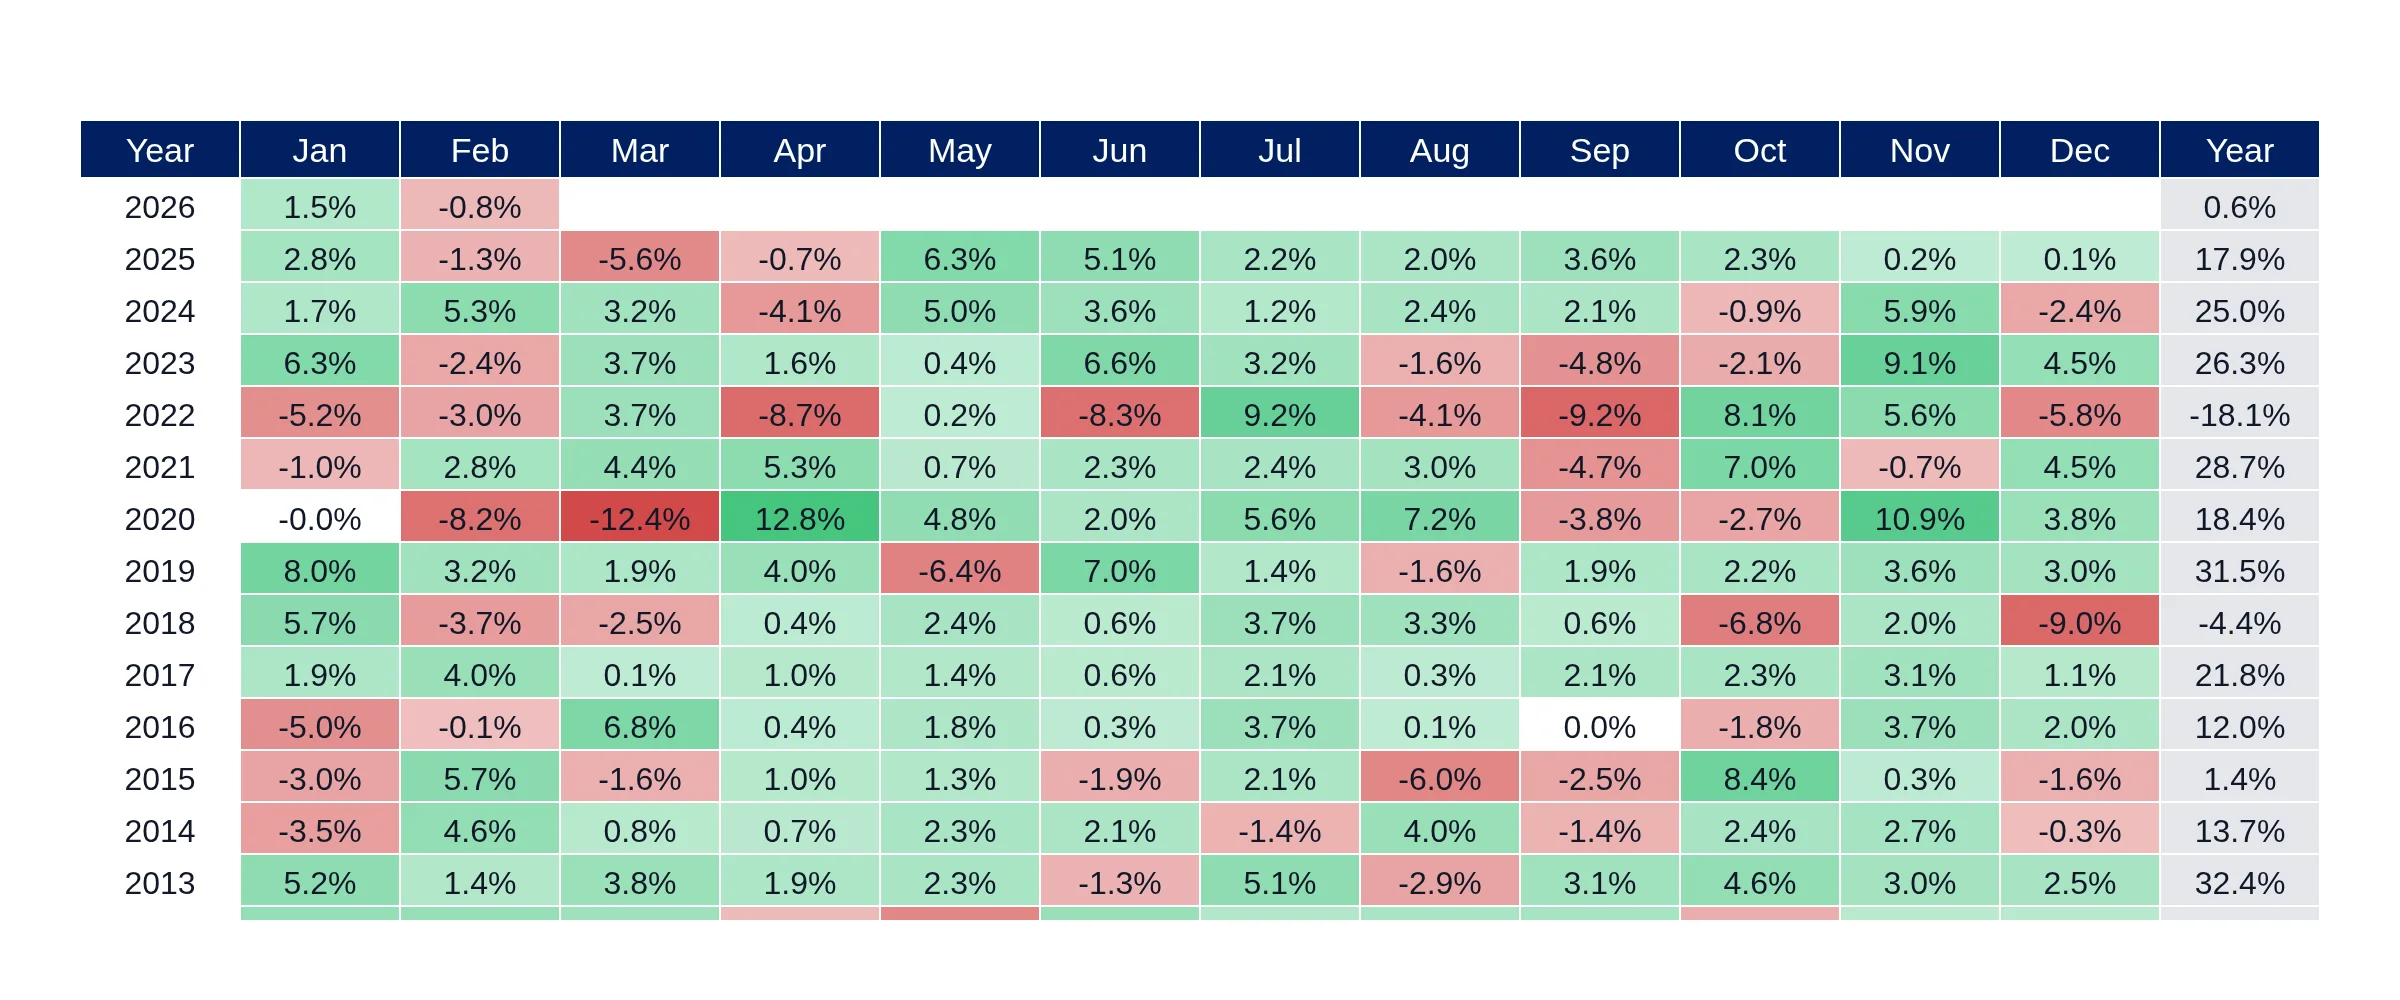
The methodology for calculating gold returns in the dashboard is based on the change in the U.S. dollar price of gold from the end of one calendar year to the next. This includes both yearly percentage performance and monthly returns, ensuring comprehensive insights into gold as an investment.
Yes, the Gold Annual Returns by Year dashboard allows users to download all values for further analysis. This feature is particularly useful for traders and analysts looking to conduct in-depth evaluations of historical gold performance.
Returns are based on the change in the U.S. dollar price of gold from the end of one calendar year to the next. The dashboard shows both yearly percentage performance and monthly returns, using daily gold price data aggregated to calendar periods. All values are total returns in USD and can be downloaded for further analysis.