Compare Europe’s annual and monthly HICP inflation rates across years.
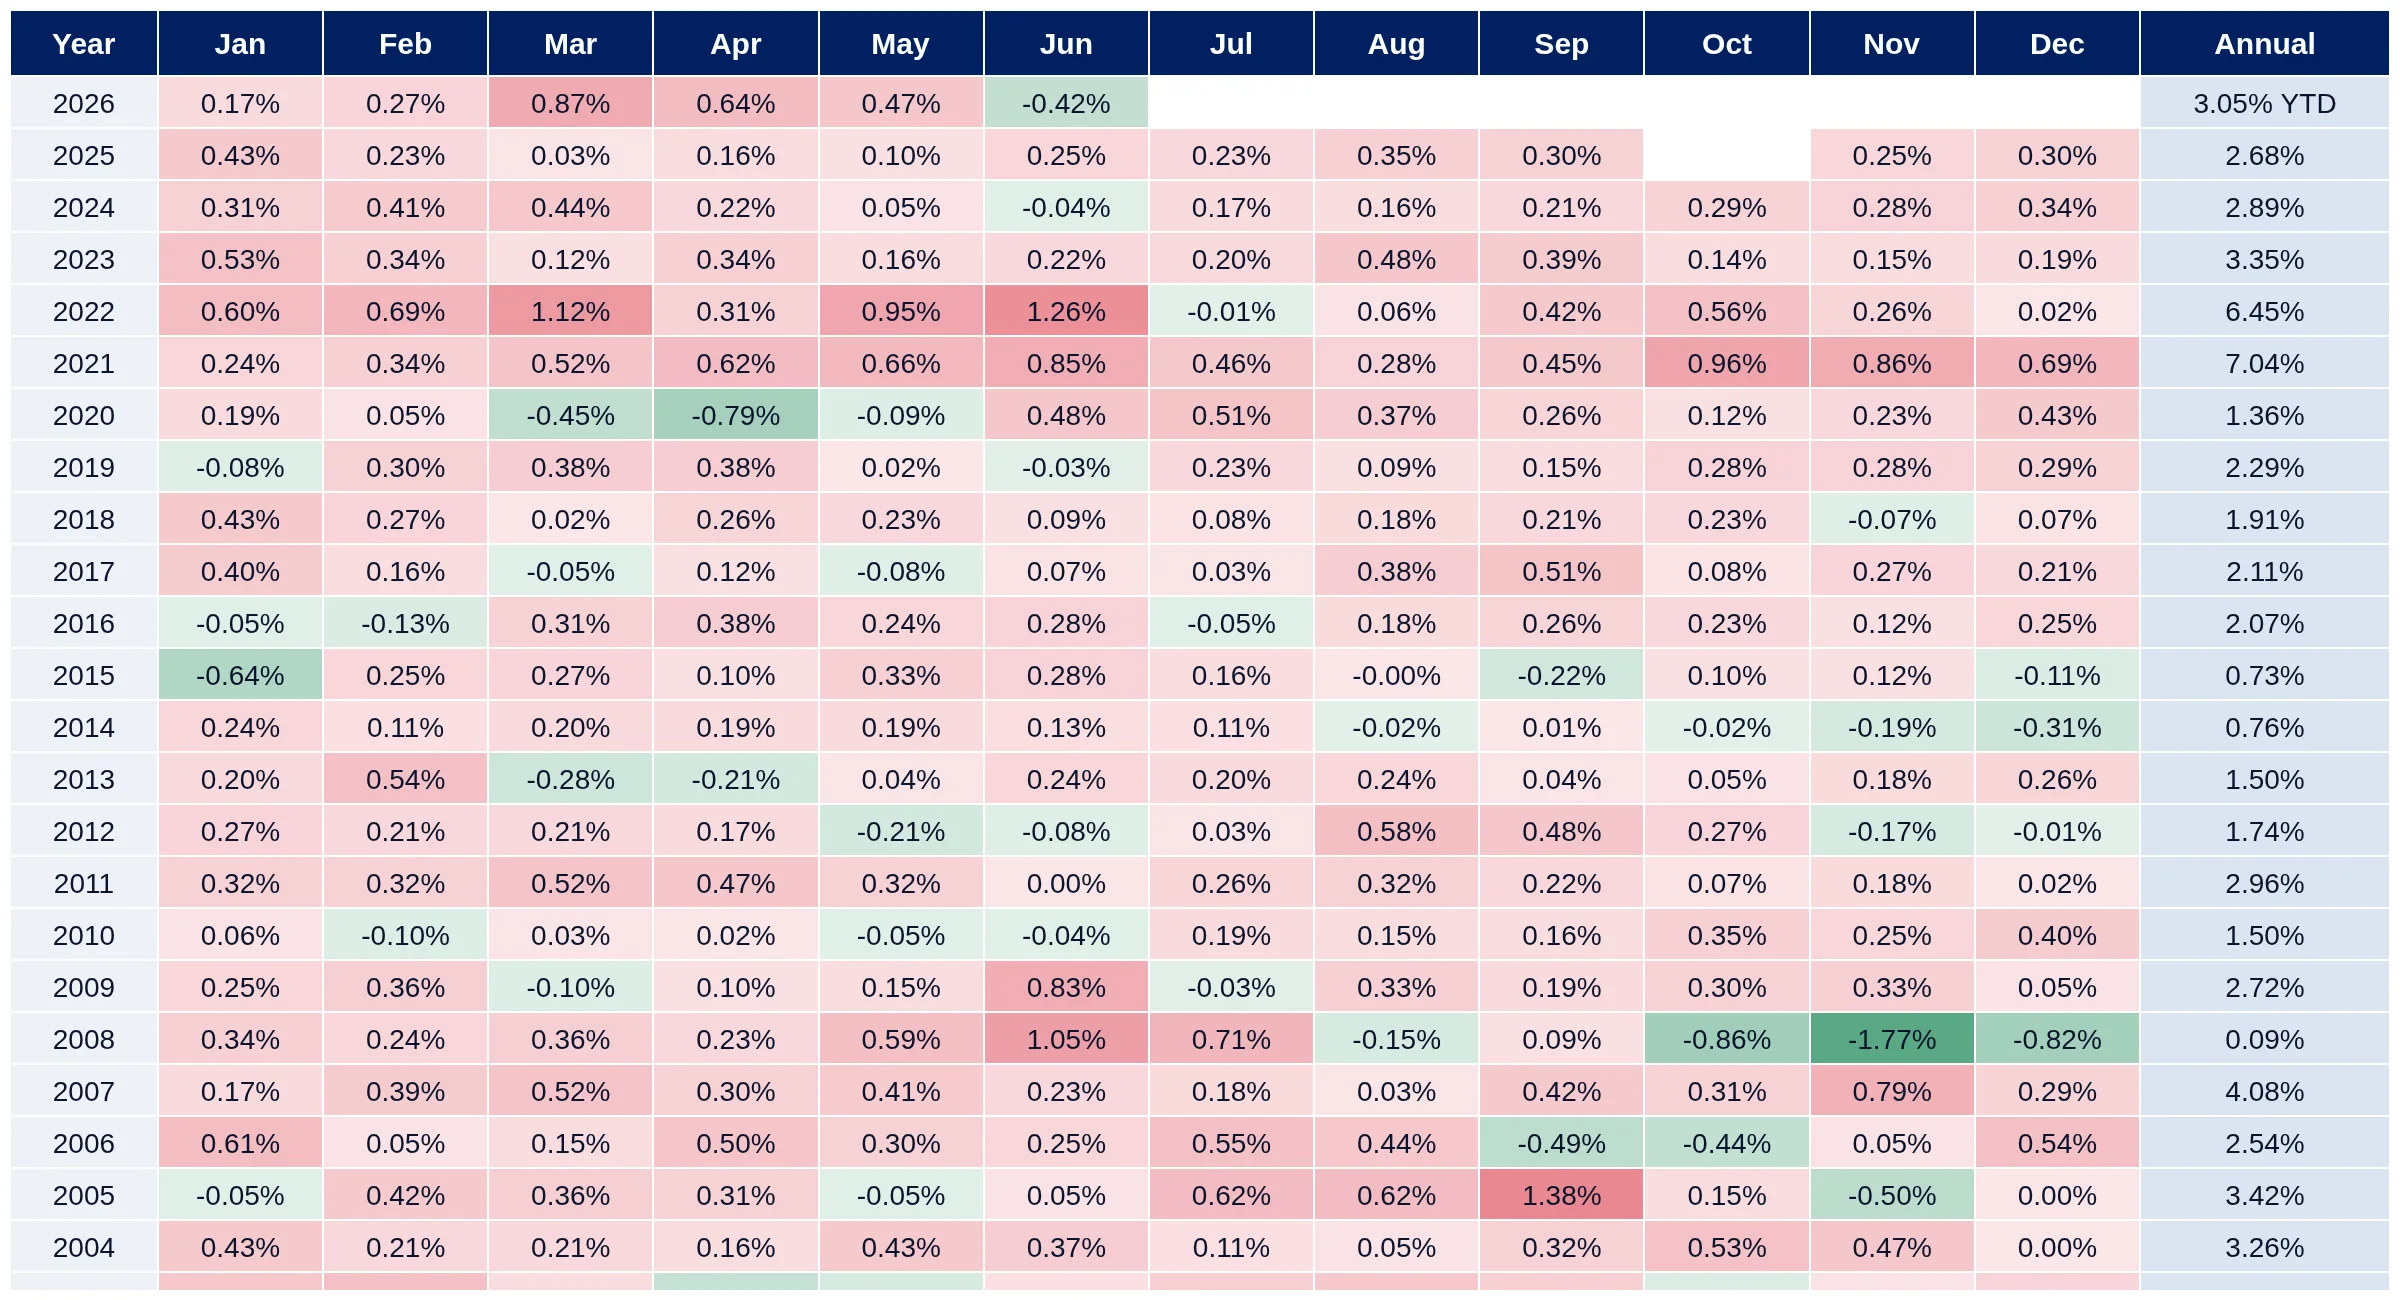
The annual inflation rate in the Europe Inflation Rate by Year dashboard is calculated using the not-seasonally-adjusted Euro area Harmonised Index of Consumer Prices (HICP). It compares the final available observation of the current year to the final observation of the previous year, providing a clear view of inflation trends.
The monthly inflation rate displayed in the dashboard represents the month-over-month percentage change in the not-seasonally-adjusted HICP for the Euro area. This metric helps investors and analysts track short-term inflation fluctuations and consumer price changes.
Yes, the dashboard includes year-to-date (YTD) inflation data for incomplete current years. This is calculated by comparing the latest observation of the current year with the final observation of the previous calendar year, allowing users to assess inflation trends up to the present date.
Monthly inflation is the month-over-month percentage change in the not-seasonally-adjusted Euro area Harmonised Index of Consumer Prices (HICP). Annual inflation also uses this NSA index and is calculated from the final available observation in each calendar year to the final observation in the previous year. For an incomplete current year, the latest observation is compared with the previous calendar year's final observation and marked YTD.