Compare annual US inflation and seasonally adjusted monthly CPI changes across years.
The US Inflation Rate by Year dashboard allows you to compare annual inflation rates calculated from the not-seasonally-adjusted Consumer Price Index (CPI). By examining the annual inflation chart, you can identify trends and fluctuations in inflation over multiple years, providing valuable insights for economic analysis.
In this dashboard, monthly CPI reflects the month-over-month percentage changes in the seasonally adjusted Consumer Price Index, while annual inflation is based on the not-seasonally-adjusted CPI calculated from the final observations of each calendar year. This distinction helps investors understand short-term versus long-term inflation trends.
The monthly inflation data in the dashboard is seasonally adjusted to account for predictable seasonal variations in consumer prices, providing a clearer view of underlying inflation trends. This adjustment allows traders and analysts to make more accurate comparisons of monthly inflation rates without the noise of seasonal fluctuations.
Monthly inflation is the month-over-month percentage change in the seasonally adjusted Consumer Price Index for All Urban Consumers: All Items in U.S. City Average. Annual inflation uses the not-seasonally-adjusted version of the same CPI index and is calculated from the final available CPI observation in each calendar year to the final observation in the previous year. For an incomplete current year, the latest available CPI observation is compared with the previous calendar year's final observation. Values may differ from changes calculated from published rounded index levels.
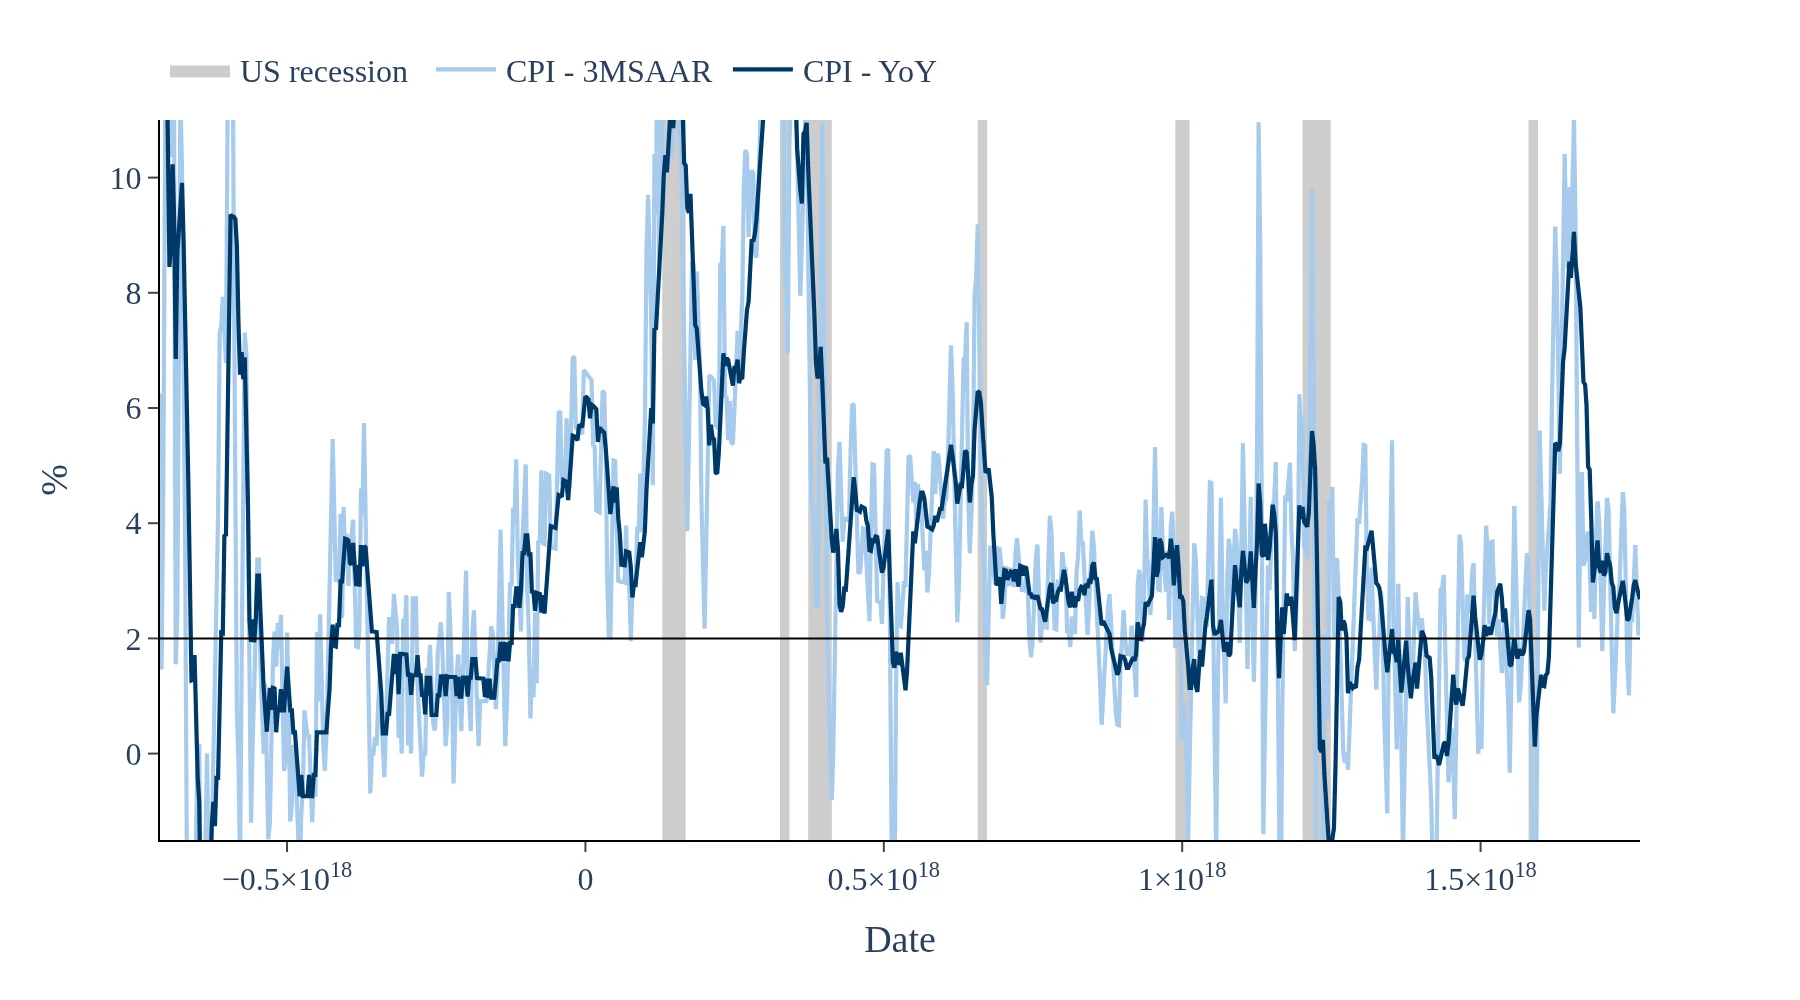
US CPI data in a visual nutshell
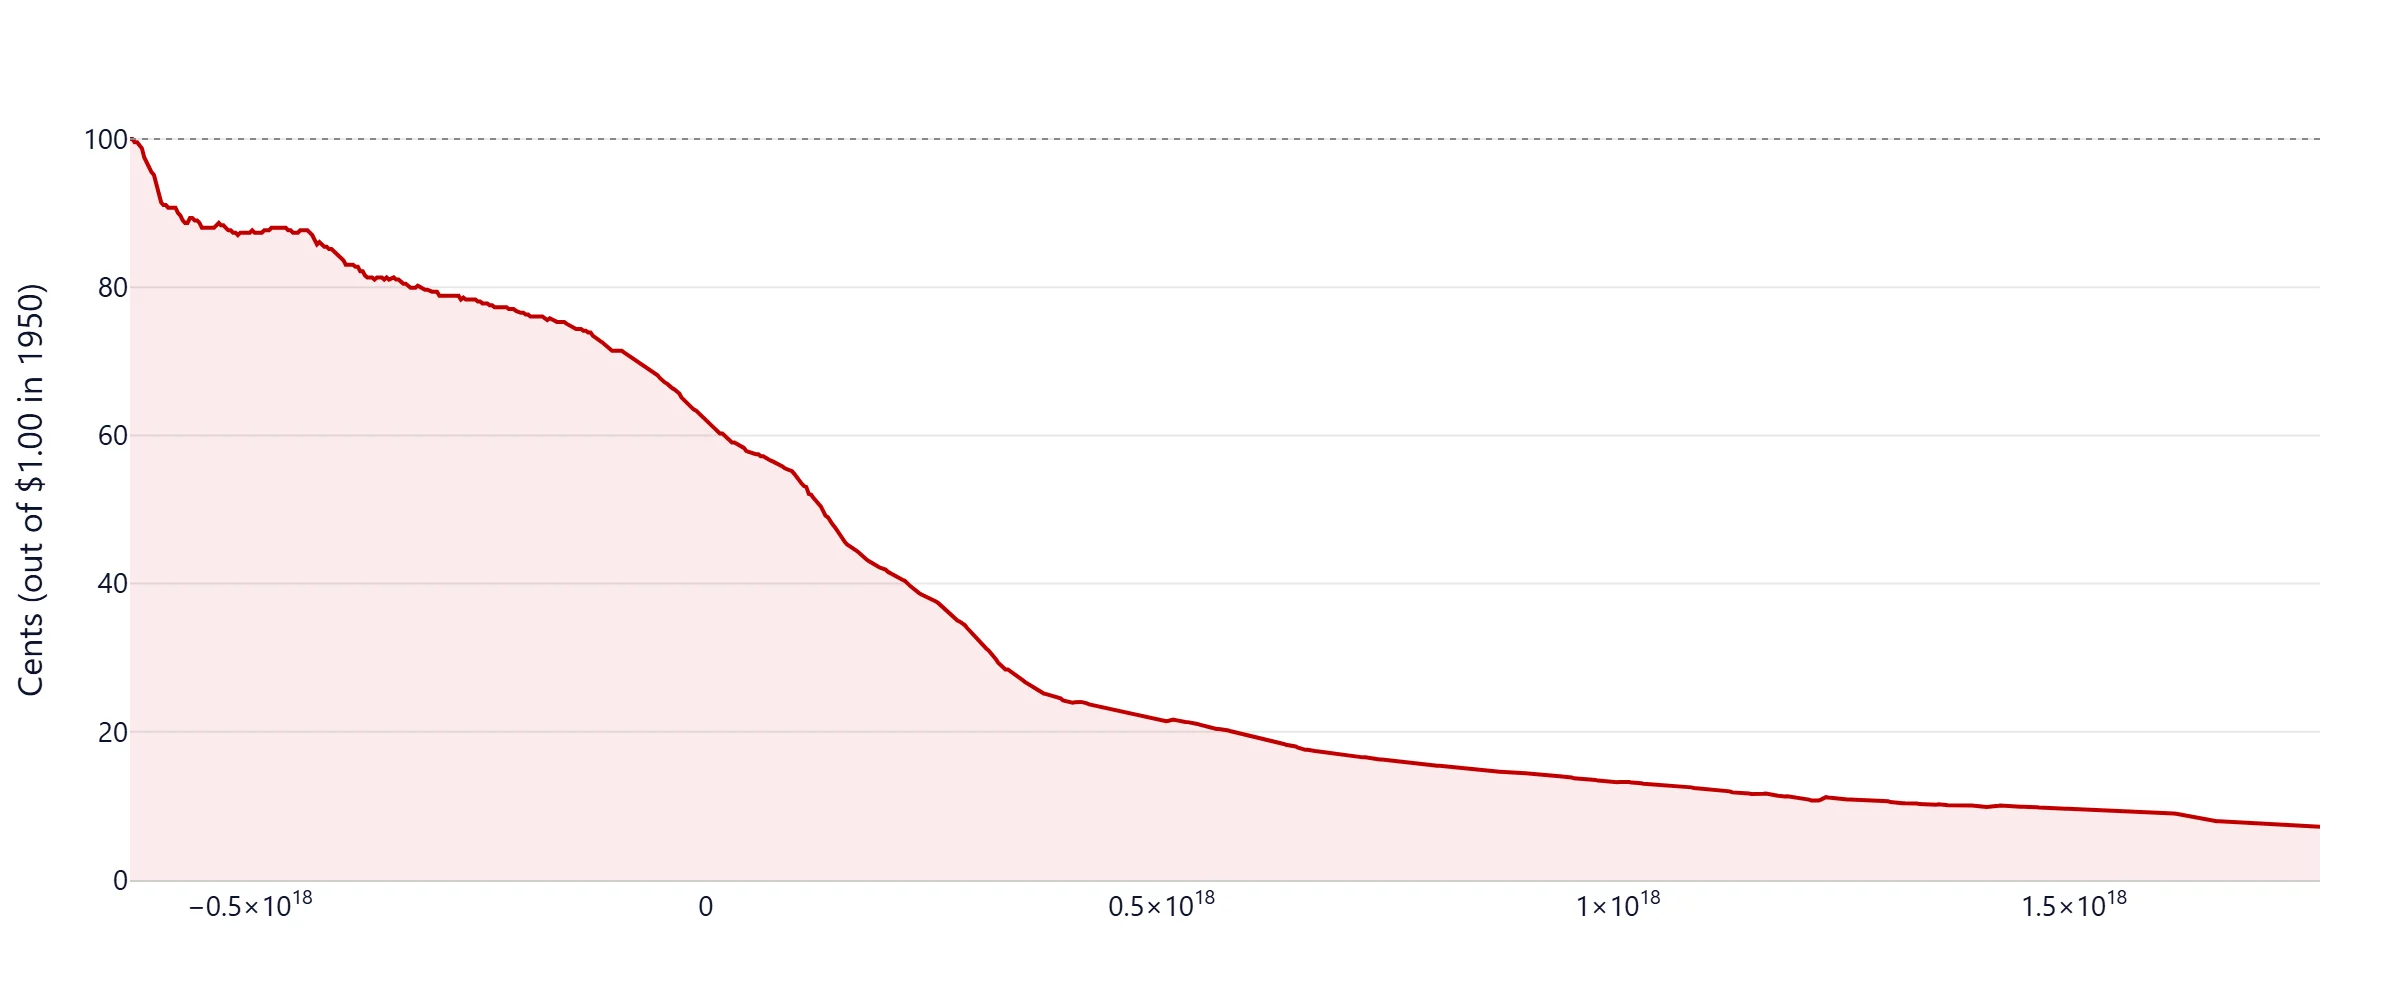
How much is your money really worth? Calculate how inflation erodes purchasing power over time.
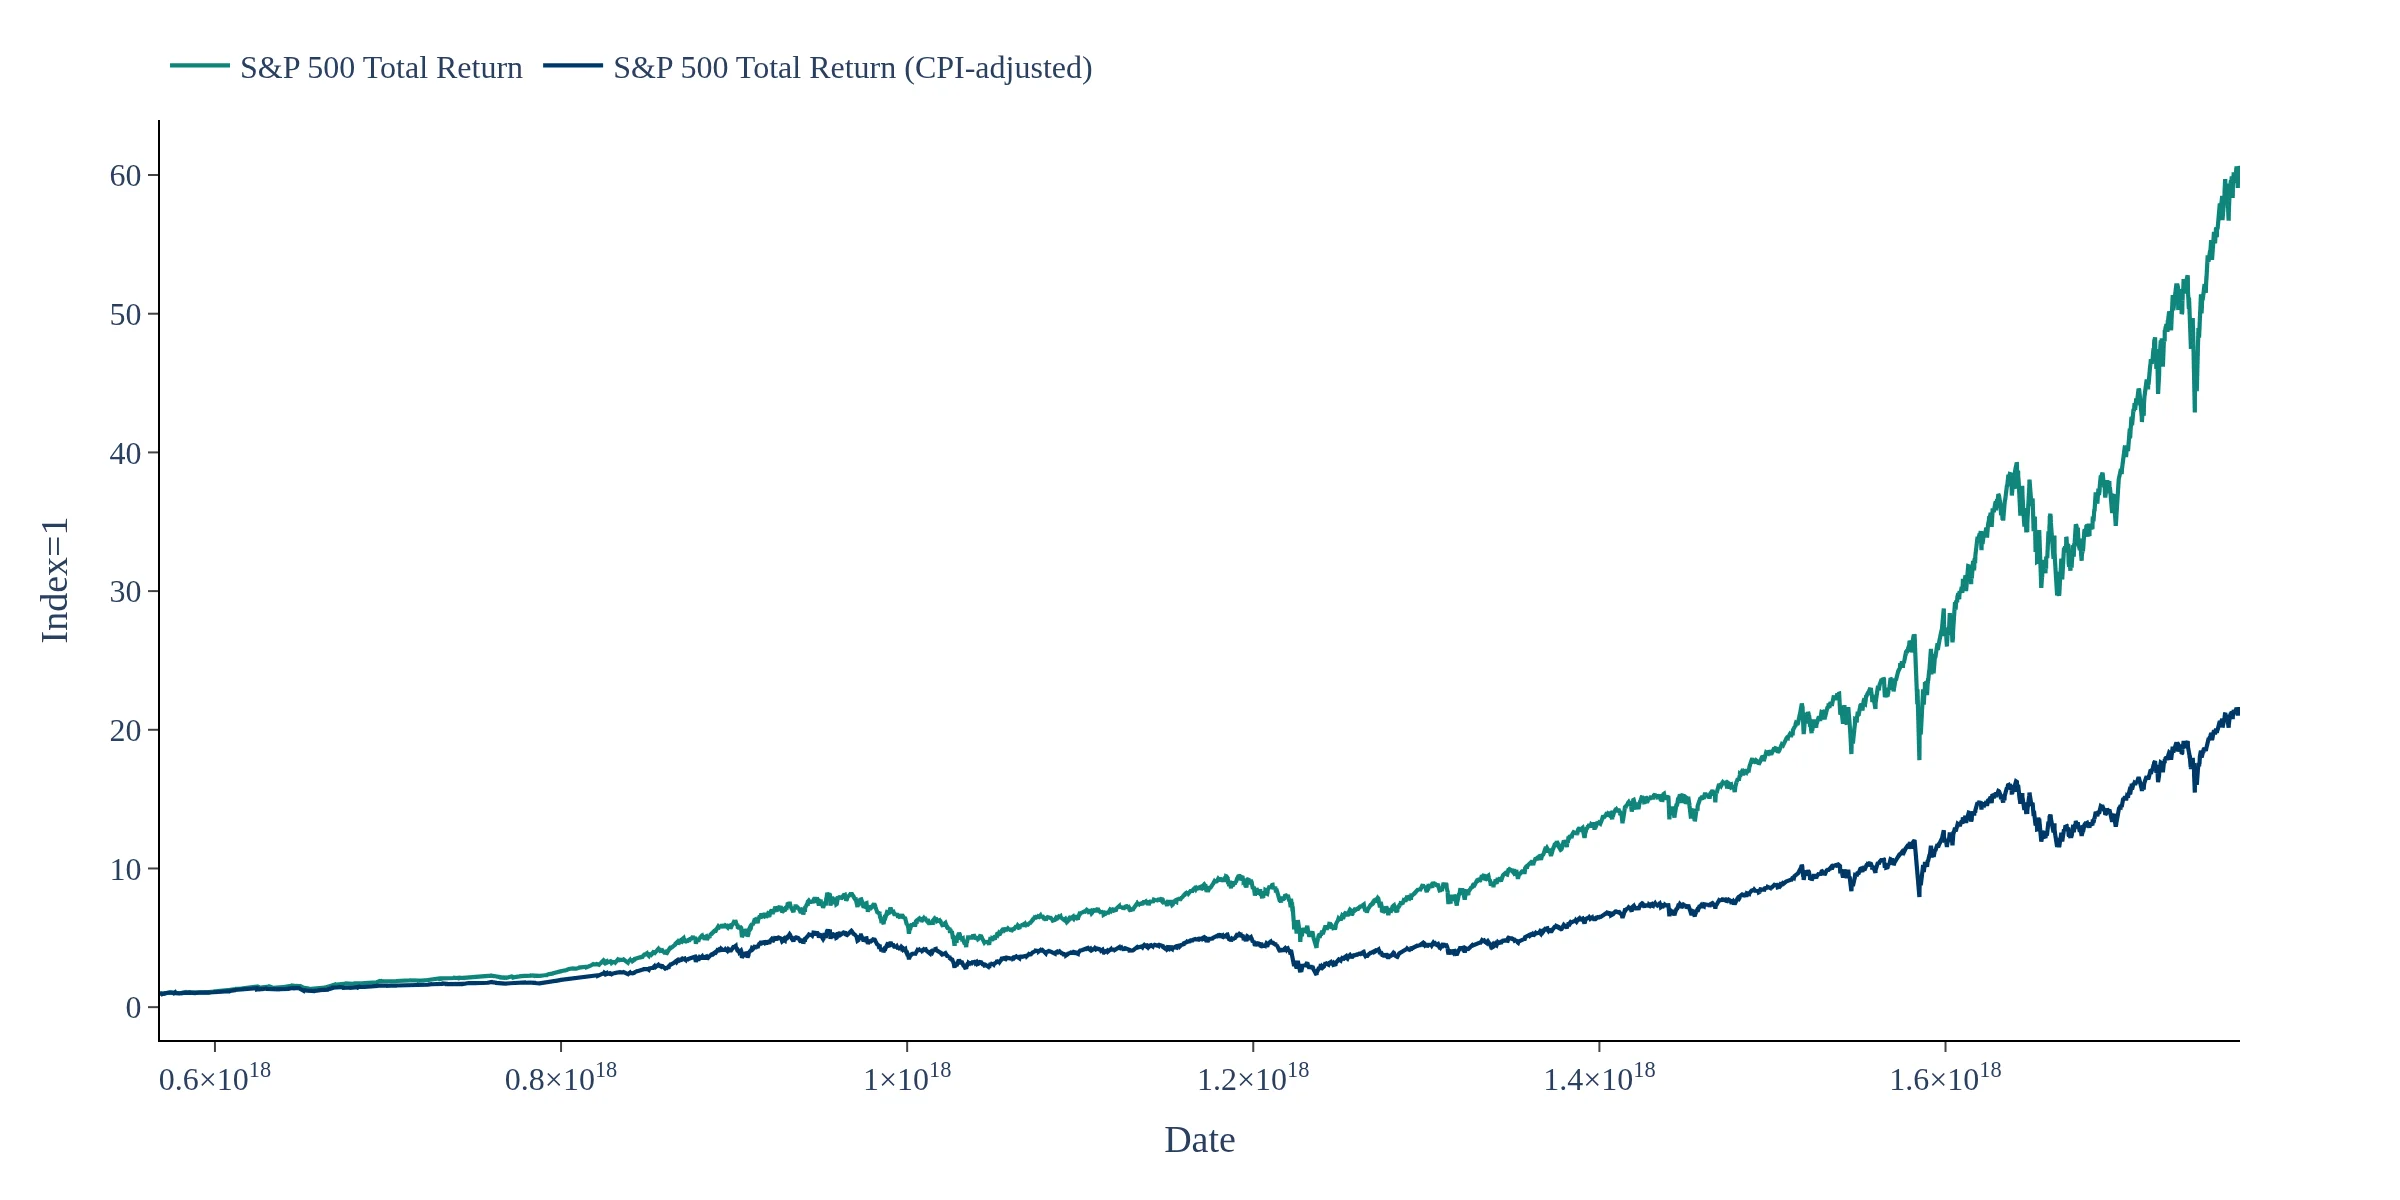
US S&P 500 Total Return, CPI-adjusted. Get real insight into how purchasing power is evolving in US Equities