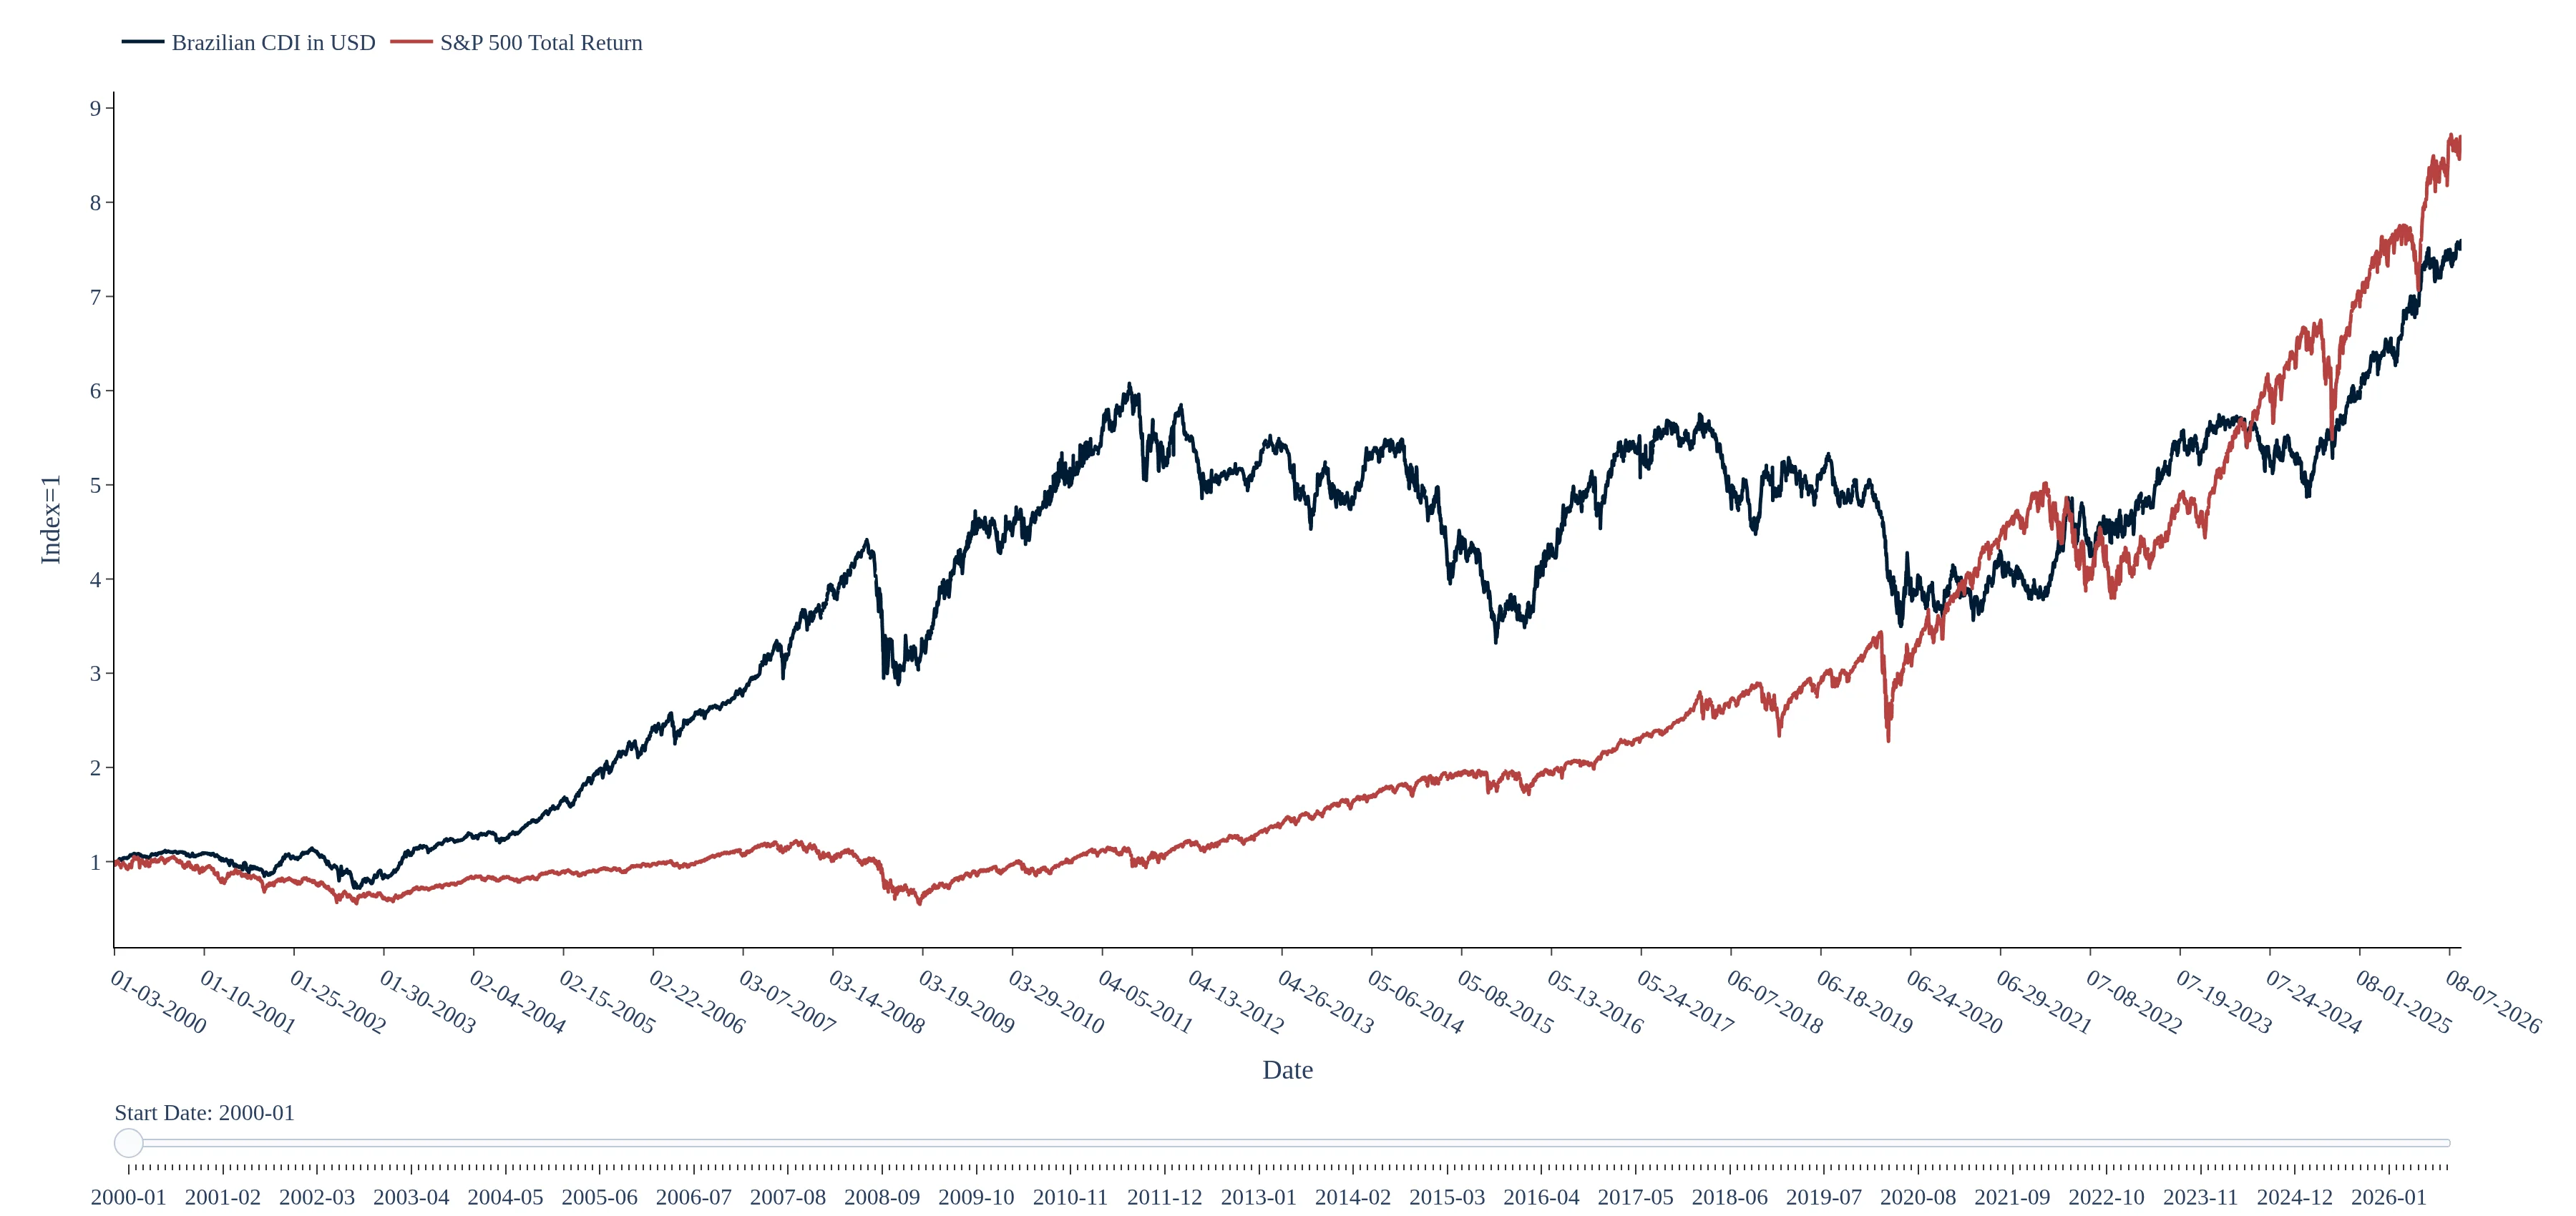
Compare the cumulative BRL performance of the S&P 500 Total Return Index with and without currency hedging.
Currency hedging can significantly impact the performance of the S&P 500 Total Return Index when expressed in BRL. The dashboard compares hedged and unhedged returns, showing that the hedged series accounts for currency fluctuations by adjusting for the daily CDI return and a fixed annualized adjustment, potentially leading to different cumulative returns for Brazilian investors.
The methodology for this dashboard involves calculating the unhedged S&P 500 returns by combining the USD index return with the USD/BRL exchange rate. In contrast, the hedged series approximates currency-hedge carry using the daily CDI return minus a US Treasury-bill proxy and a fixed 2% annualized adjustment, ensuring both series include dividends and are normalized over their common history.
Yes, the dashboard features a start-date slider that allows users to analyze the historical performance of the S&P 500 Total Return Index in BRL from any selected date. This functionality enables investors to assess the cumulative returns of both hedged and unhedged profiles over time, providing valuable insights into the impact of currency movements on investment outcomes.
This monitor compares two Brazilian-real return profiles for the S&P 500 Total Return Index. The unhedged series combines the USD index return with the USD/BRL exchange rate. The hedged series approximates currency-hedge carry using the daily CDI return less a US Treasury-bill proxy and a fixed 2% annualized cupom cambial/Fed funds adjustment. Both series include S&P 500 dividends and are normalized over their common history. Use the start-date slider to compare performance from any selected date.