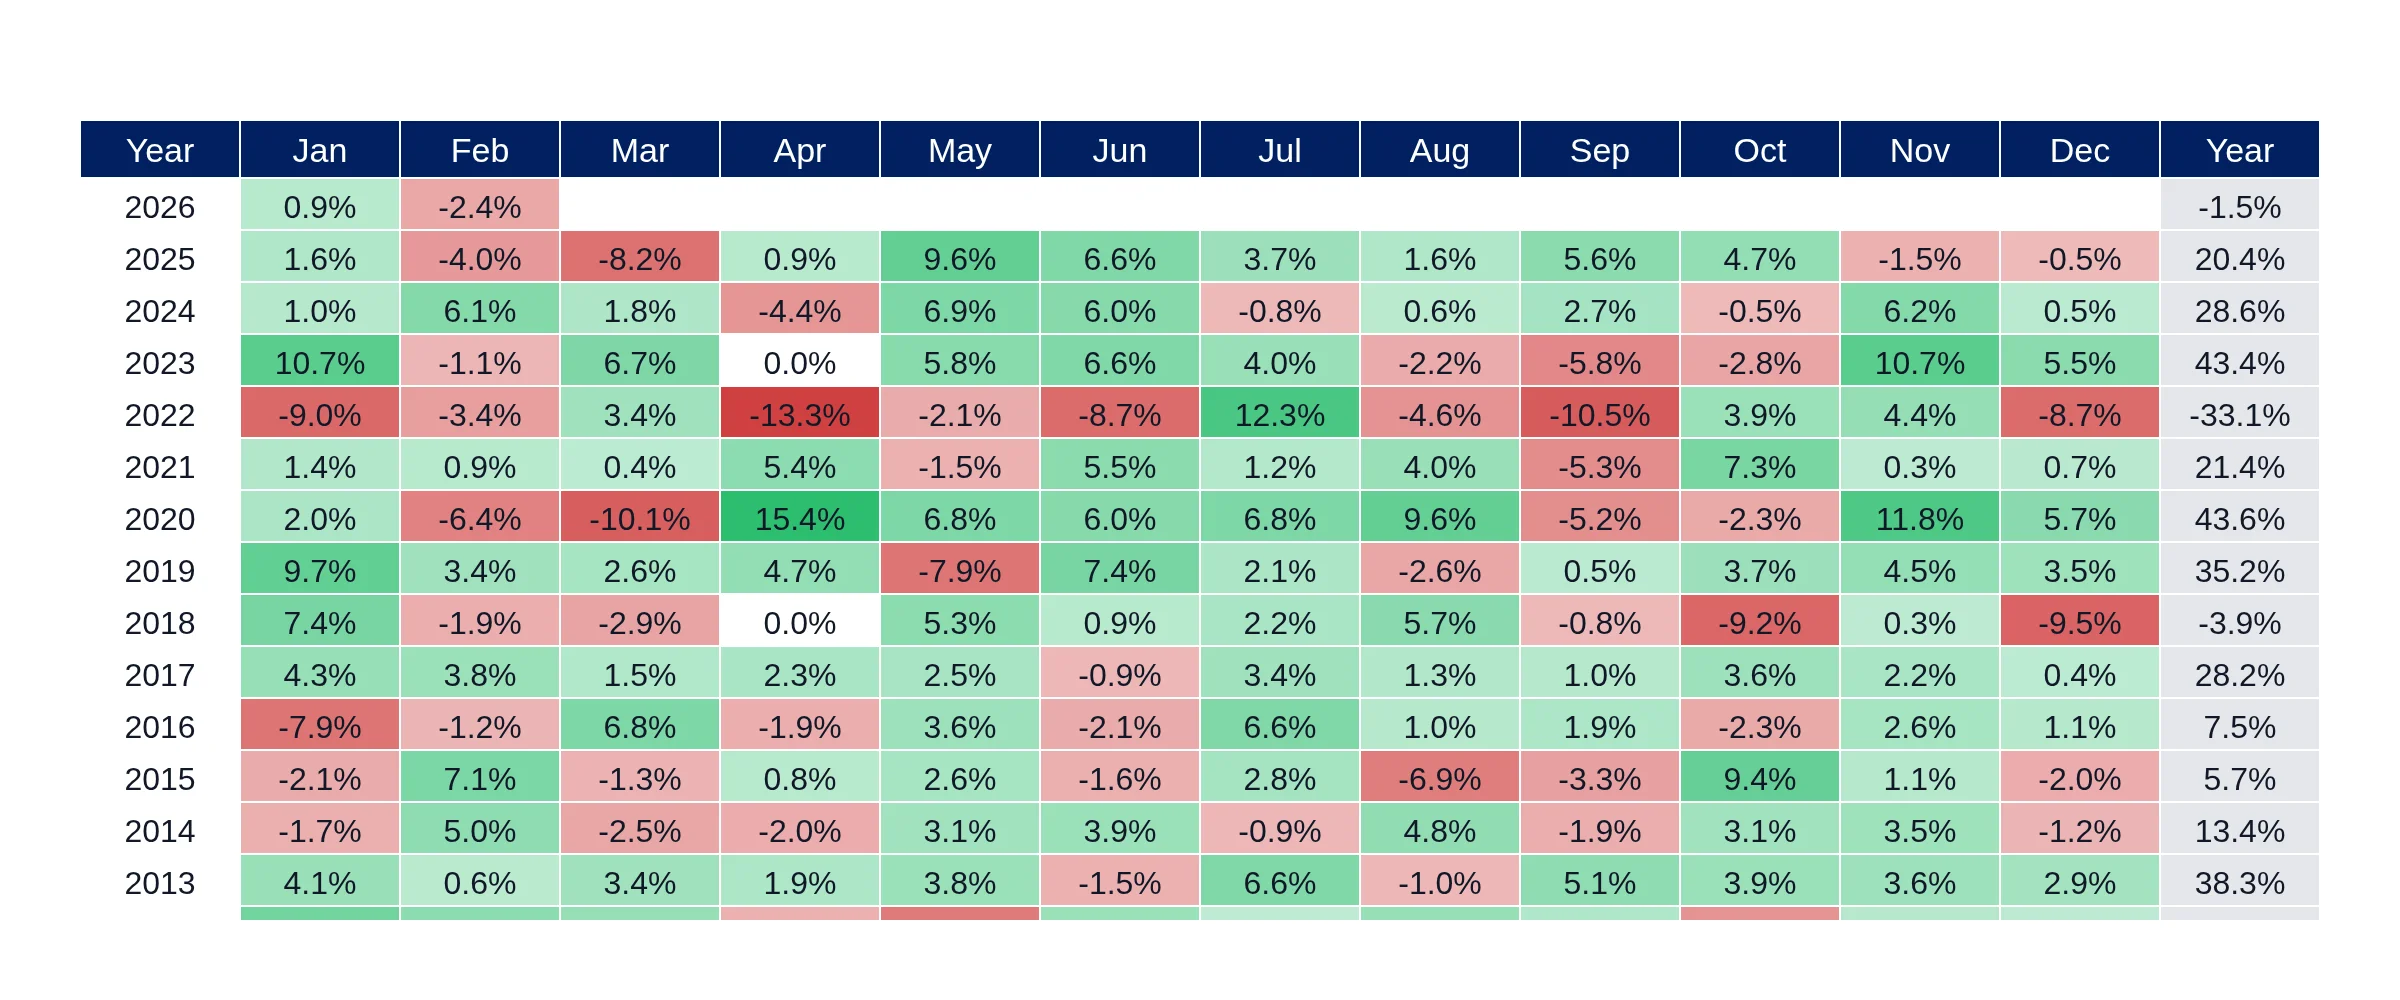
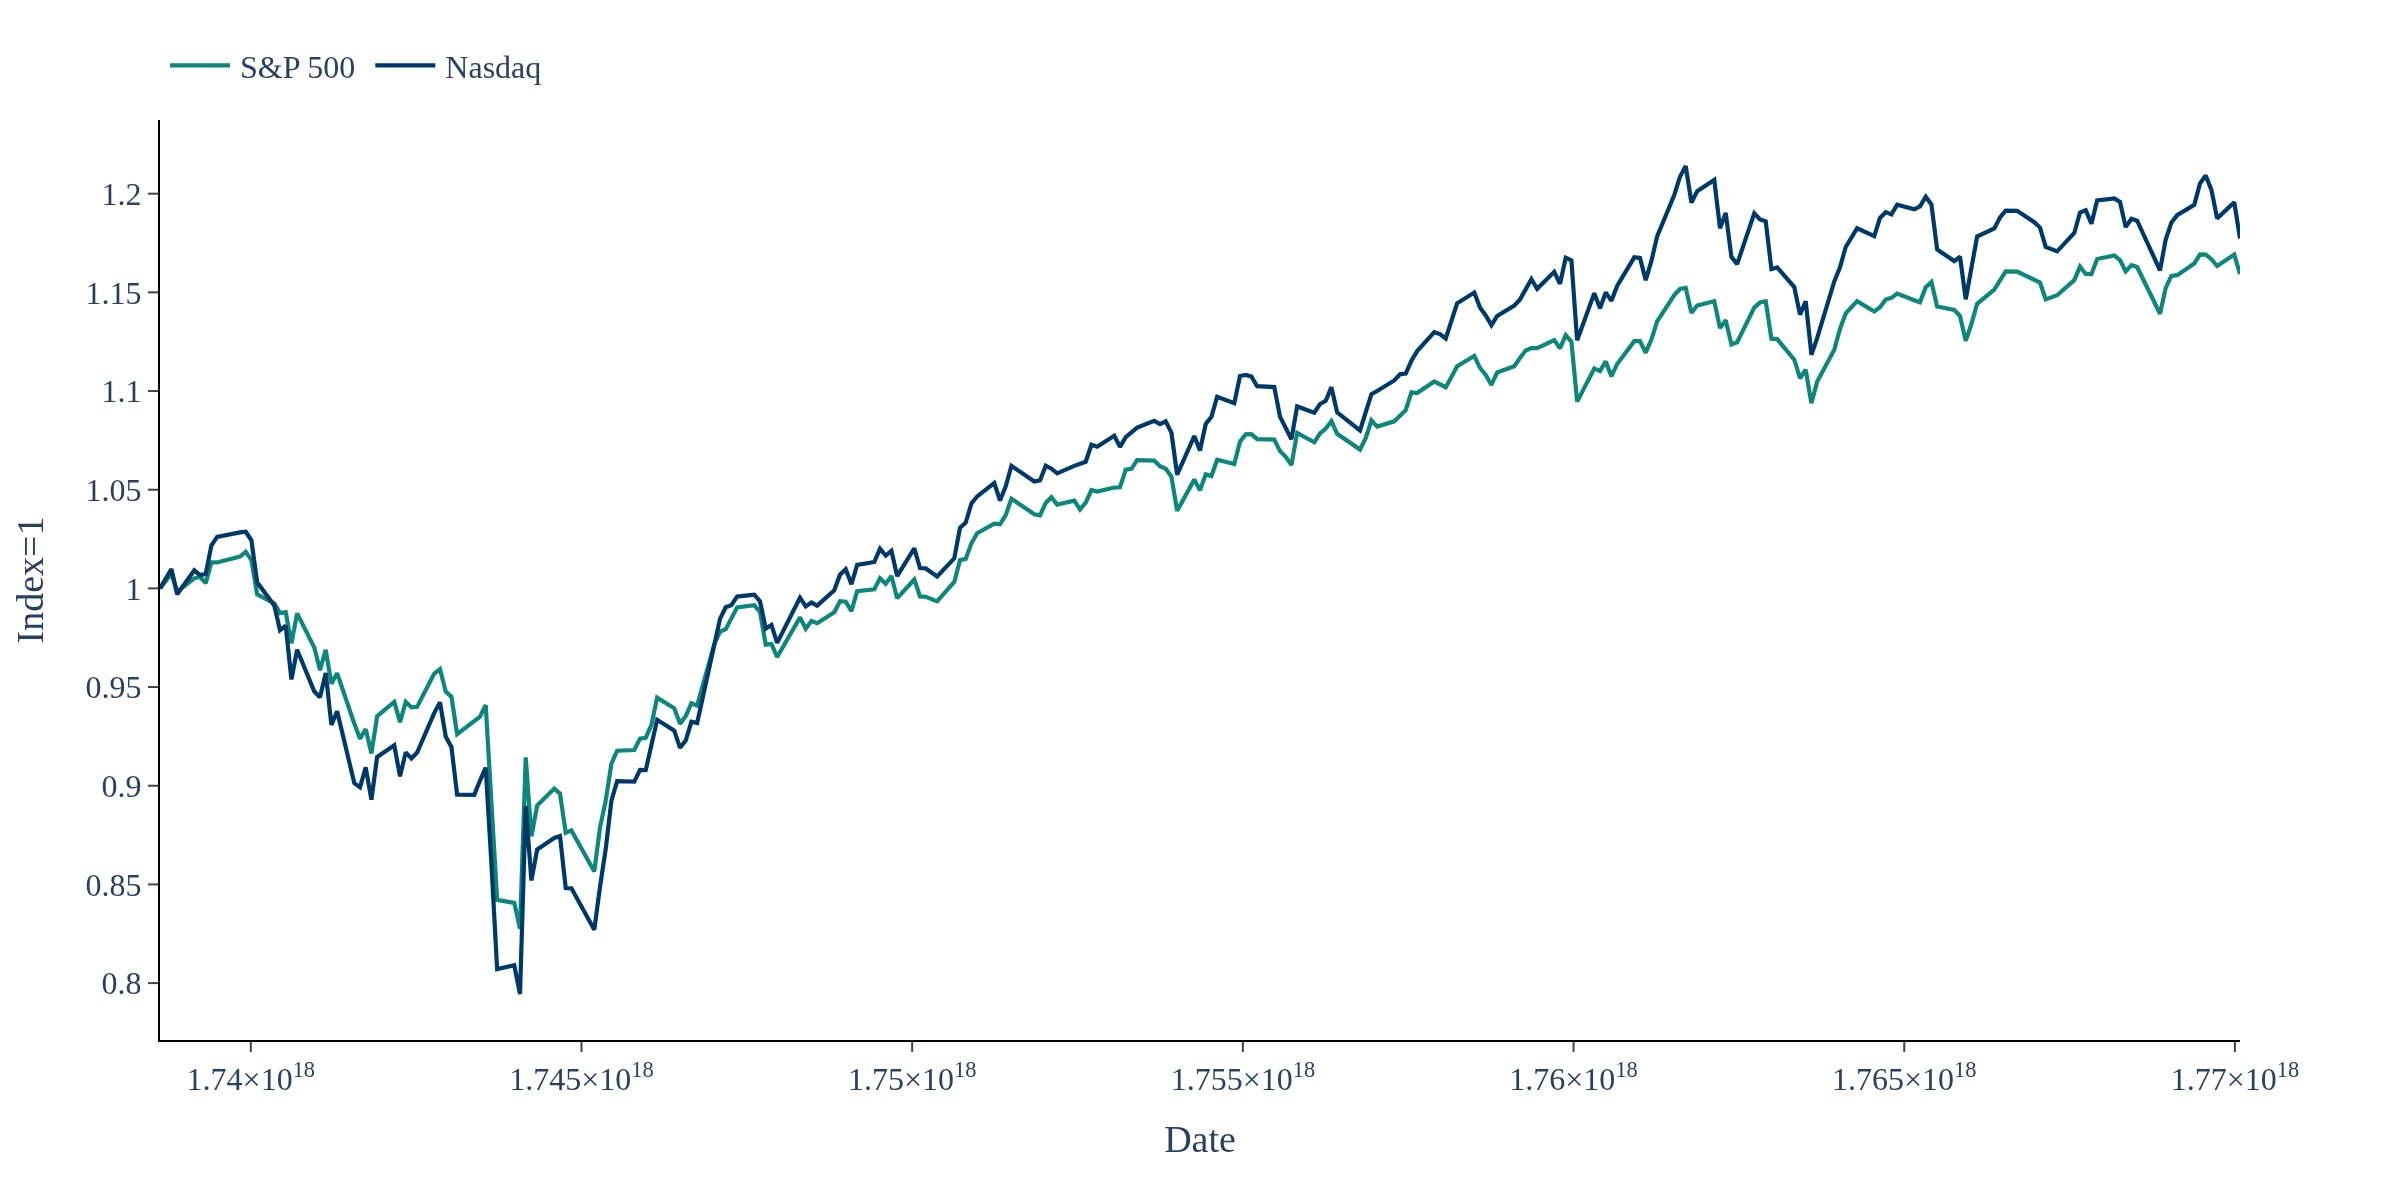
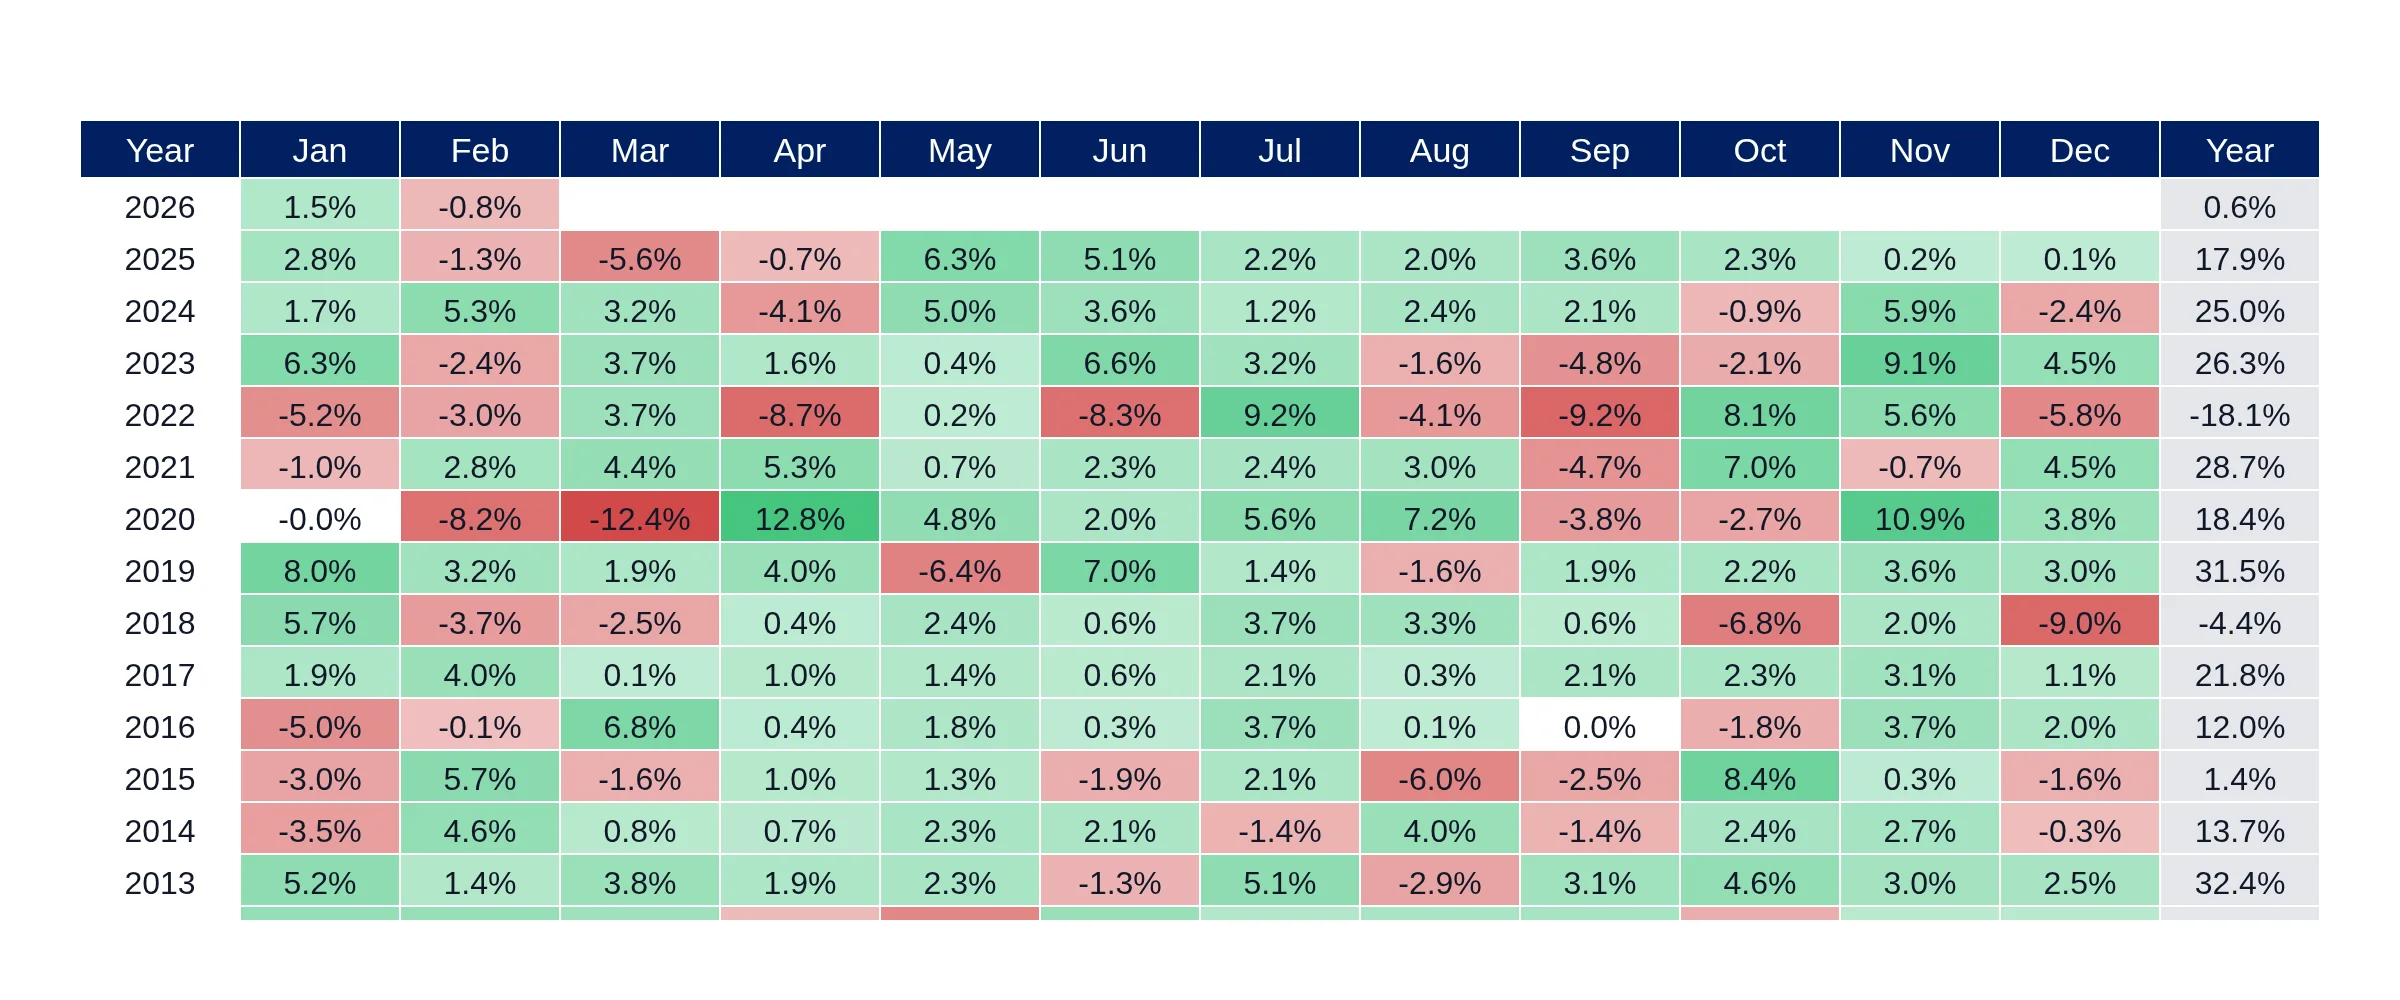
Historical annual and monthly returns for NXP Semiconductors (NXPI).
For NXP Semiconductors (NXPI), the strongest completed calendar year was 2019, when the stock returned 75.7%, while its weakest was 2018, with a return of -37.0%. Across the 15 completed calendar years from 2011 through 2025, its average annual return was 23.9% and its compounded annual return was 17.8%. NXPI posted positive returns in 11 of those 15 years (73%). In 2025, the latest completed year, it returned 6.4%. In 2026 year to date, NXPI has returned 10.3%.
Returns are calculated from the adjusted daily closing prices for NXP Semiconductors (NXPI). Annual returns measure the percentage change between the final available trading prices of consecutive calendar years. Monthly returns use the corresponding month-end observations. Adjusted prices account for stock splits and distributions when supplied by the market-data provider. Results are nominal and are not adjusted for inflation.