Dashboard consolidating the most relevant information on the US Equities Market.
The US Equities Dashboard utilizes ETF-based price series to compare the historical performance of the S&P 500 (SPY) and Nasdaq 100 (QQQ) across multiple time horizons, including 1Y, 3Y, 5Y, 10Y, and 20Y. This comparison is normalized to an index start of 1, allowing investors to evaluate relative returns and identify trends in the US equity markets.
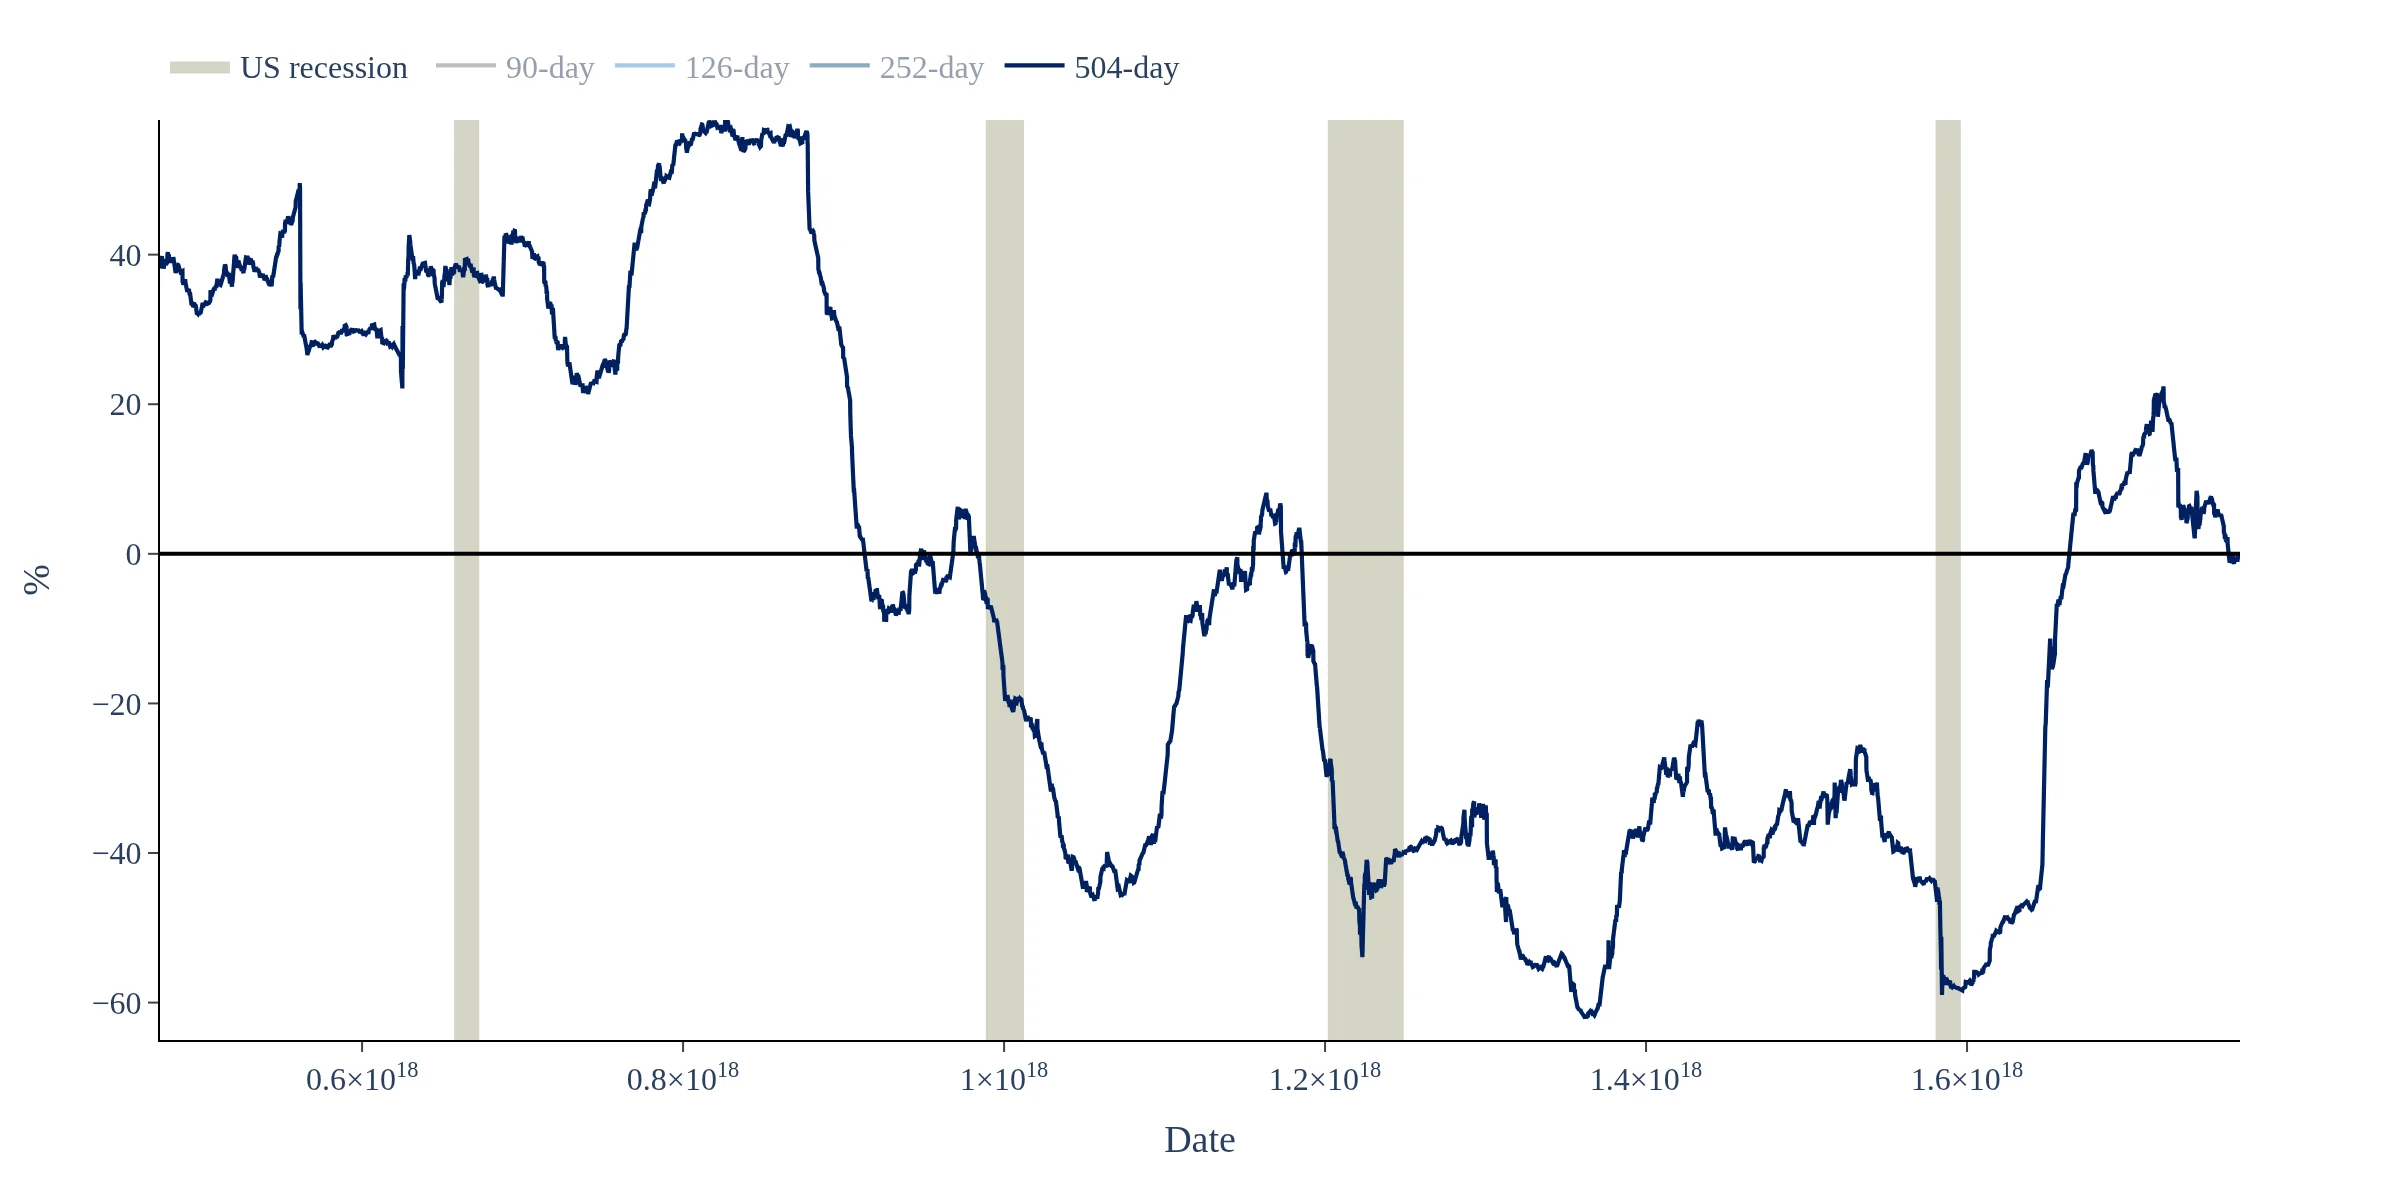
The dashboard provides detailed charts on the realized volatilities of both the S&P 500 and Nasdaq, which are crucial for understanding market risk and price fluctuations. By analyzing these volatilities, investors can assess the stability of these indices and make informed decisions regarding their investment strategies.
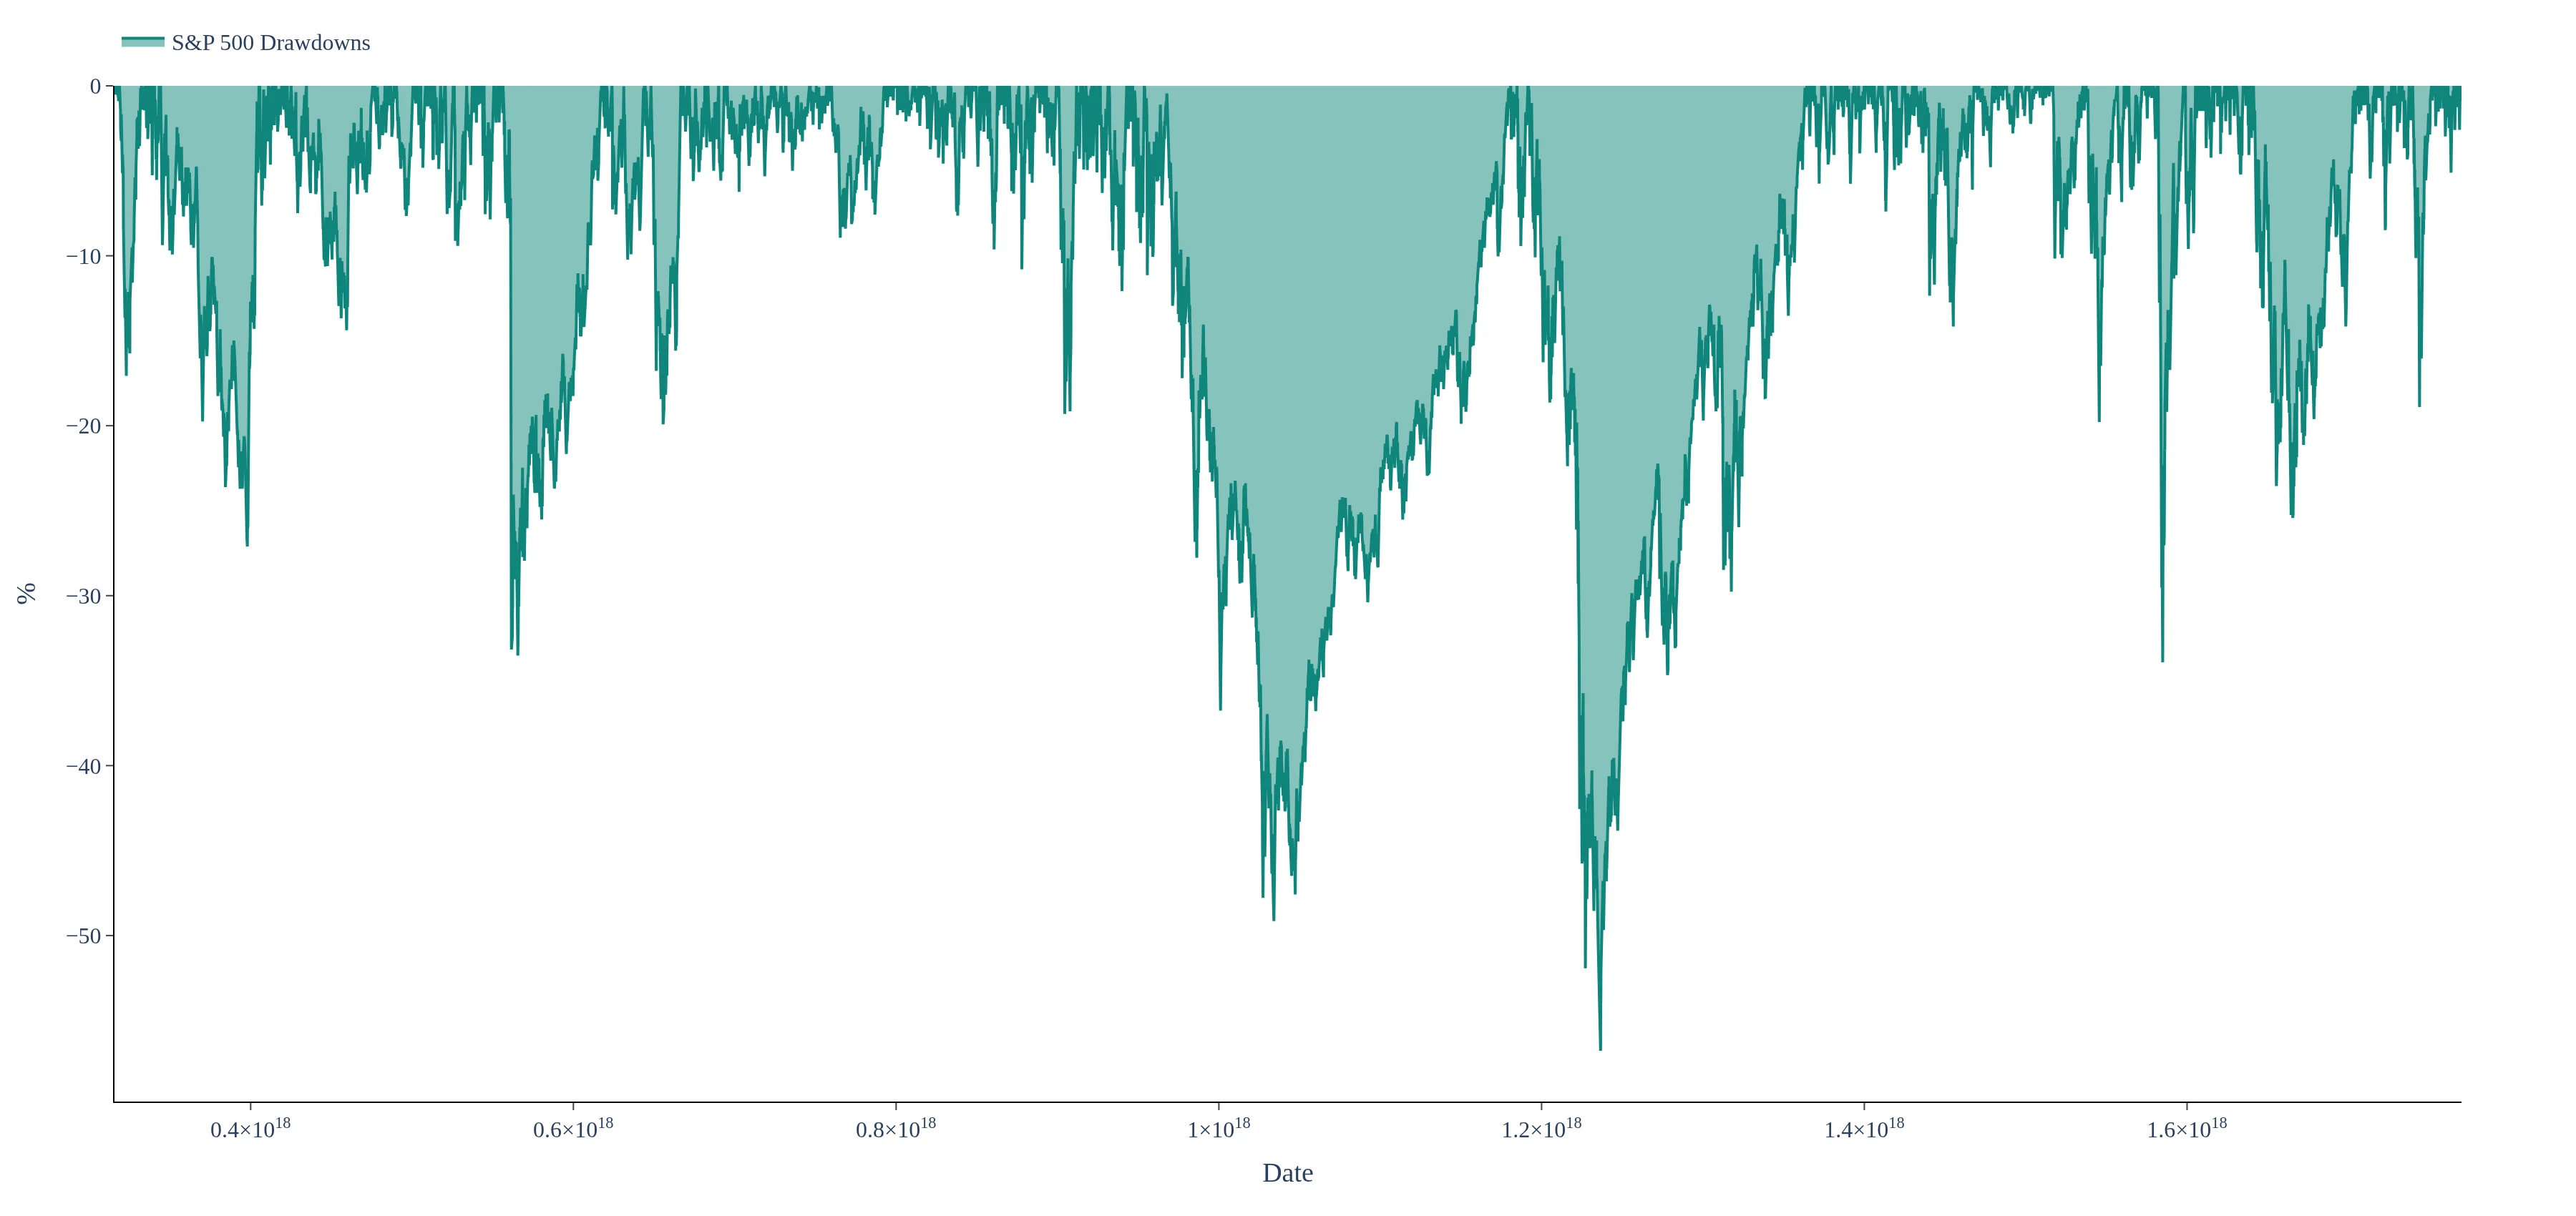
The US Equities Dashboard includes a specific chart that outlines the drawdowns experienced by both the S&P 500 and Nasdaq. This information is essential for investors looking to understand the maximum declines from peak to trough, helping them evaluate risk and potential recovery periods in the US equity markets.
This US Equities dashboard consolidates key market performance indicators for the US stock market, focusing on major benchmarks like the S&P 500 (SPY) and Nasdaq 100 (QQQ). We use ETF-based price series to compare historical performance across multiple horizons (1Y, 3Y, 5Y, 10Y, 20Y, and full history) on a normalized basis (index start = 1). This helps investors evaluate relative returns, regime shifts, and drawdown periods between broad US equity indices. The goal is to provide a clear, data-driven view of US equity market trends and long-run performance.