Dashboard consolidating the Mexican TIIE performance in US dollars.
The Mexican TIIE in USD dashboard allows investors to evaluate currency risk by tracking the performance of Mexico’s TIIE rates in US dollar terms. It combines local TIIE returns with MXN/USD currency fluctuations, enabling users to see how high local rates can lead to gains or be offset by FX depreciation.
This dashboard provides performance data indexed to 1 at the start of various time horizons, including 1Y, 3Y, 5Y, 10Y, 20Y, and the full history. This allows traders and analysts to compare the performance of Mexican TIIE in USD across different investment durations.
The data in the Mexican TIIE in USD dashboard is updated regularly with new rate and FX observations. This ensures that investors have access to the latest information for fast macro and cross-asset analysis of Mexico's short-rate exposure.
This dashboard tracks Mexico’s TIIE money market performance in US dollar terms by combining local TIIE returns with MXN/USD currency moves. The series is indexed to 1 at the start of the selected window so you can compare performance across different horizons (1Y, 3Y, 5Y, 10Y, 20Y and full history). It provides a USD-based view of Mexican carry, showing when high local rates translate into gains versus when FX depreciation offsets returns. Data is updated with new rate and FX observations and presented for fast macro and cross-asset analysis. Use it to monitor the risk and reward of holding Mexico short-rate exposure from a global investor perspective.
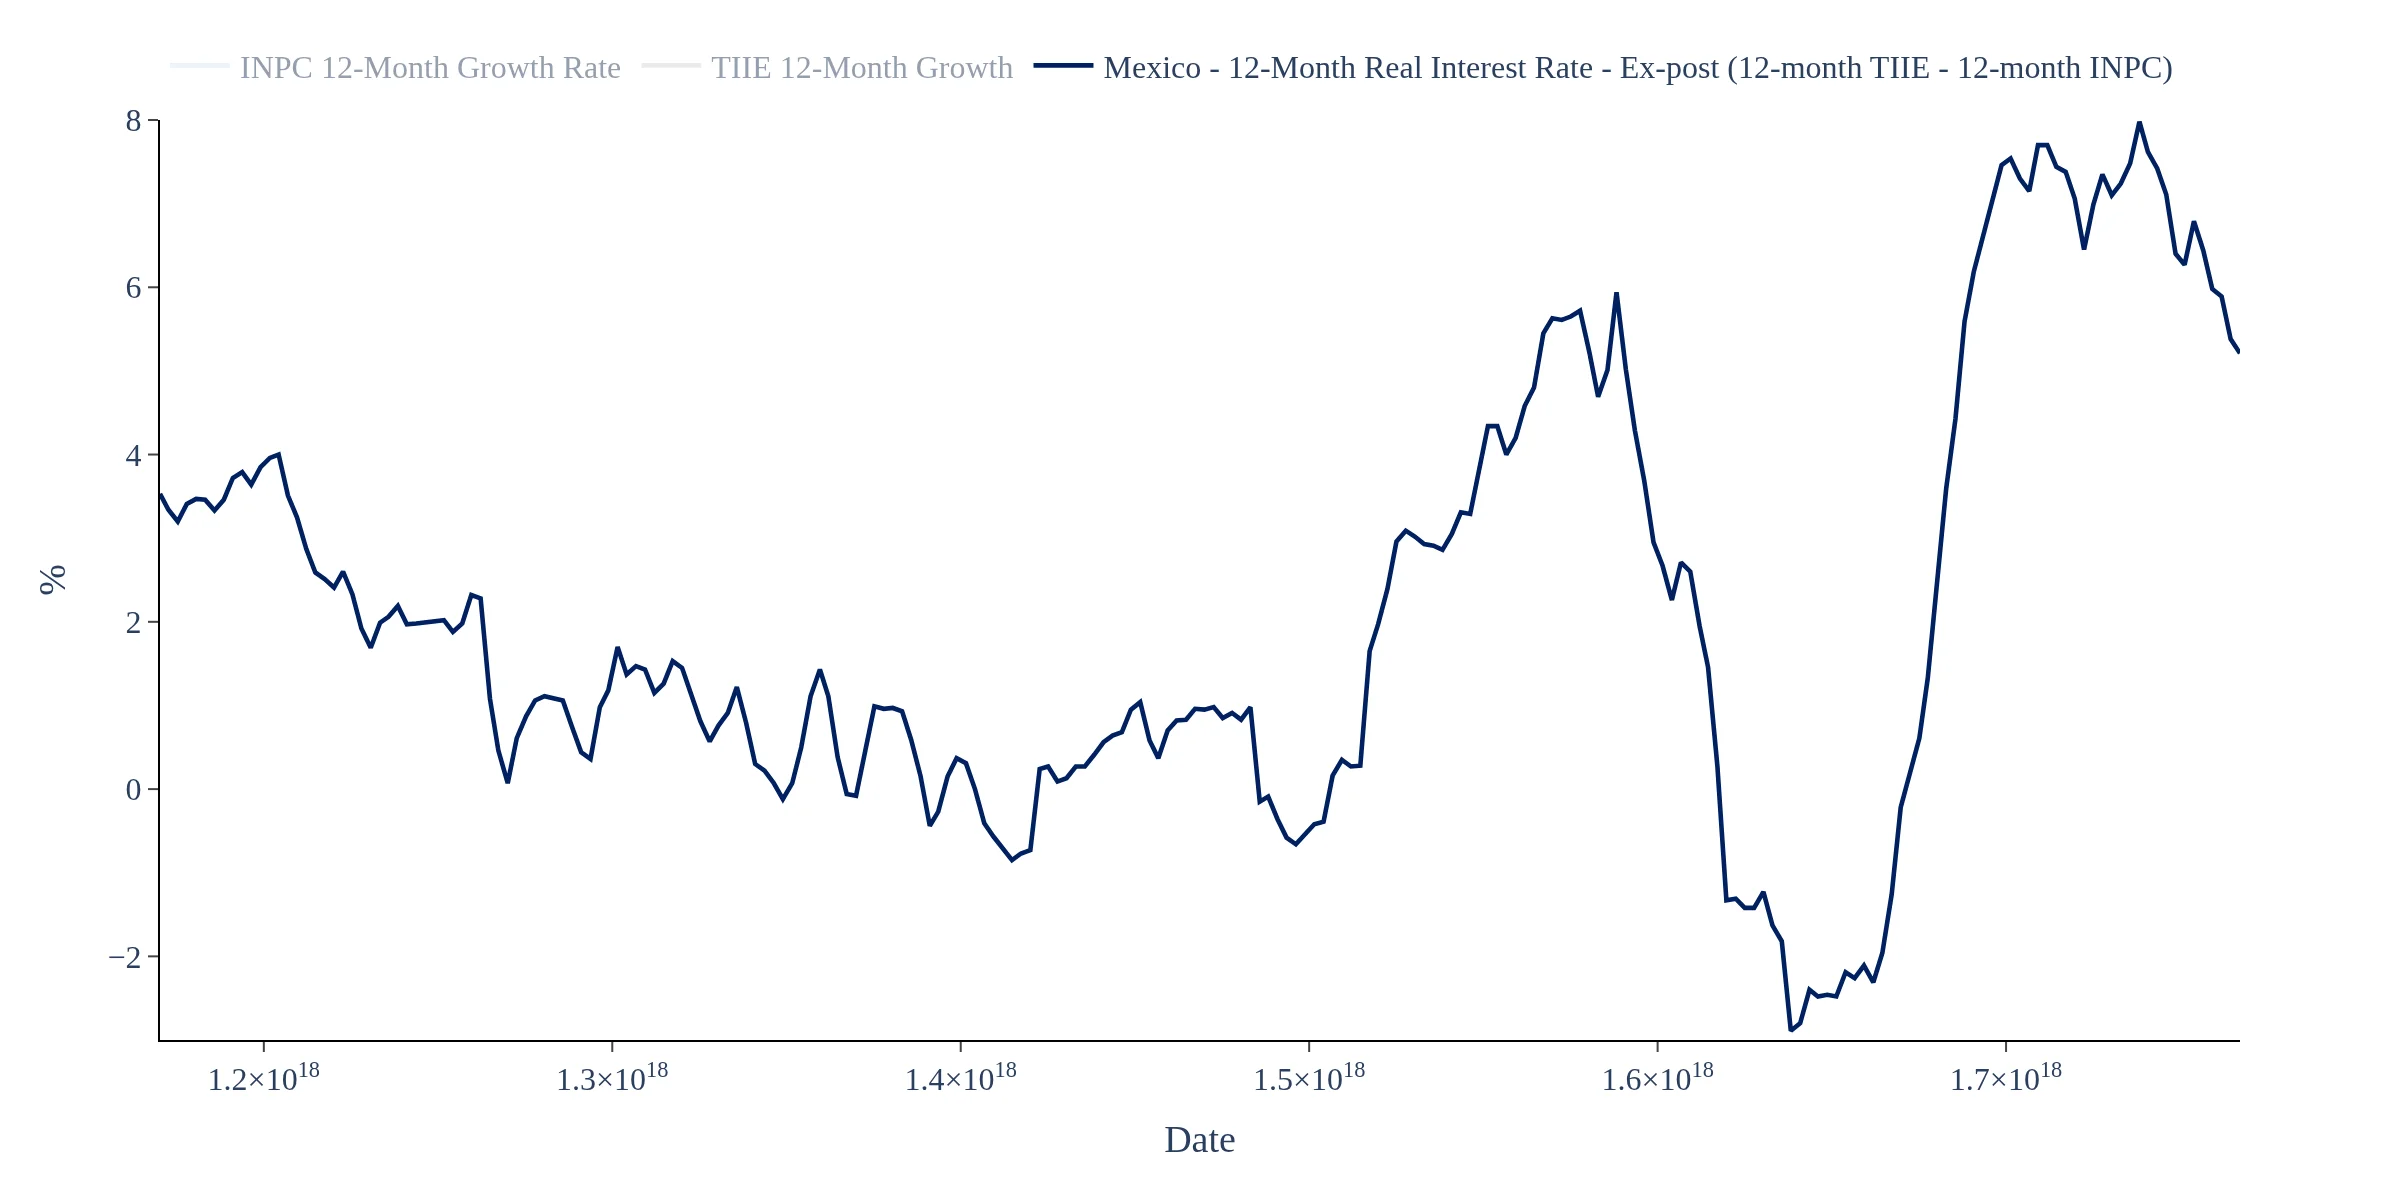
Track how are real interest rates in Mexico, from an ex-post perspective (realized 12-month benchmark rate growth - 12-month inflation)
Track the how LATAM currencies are behaving
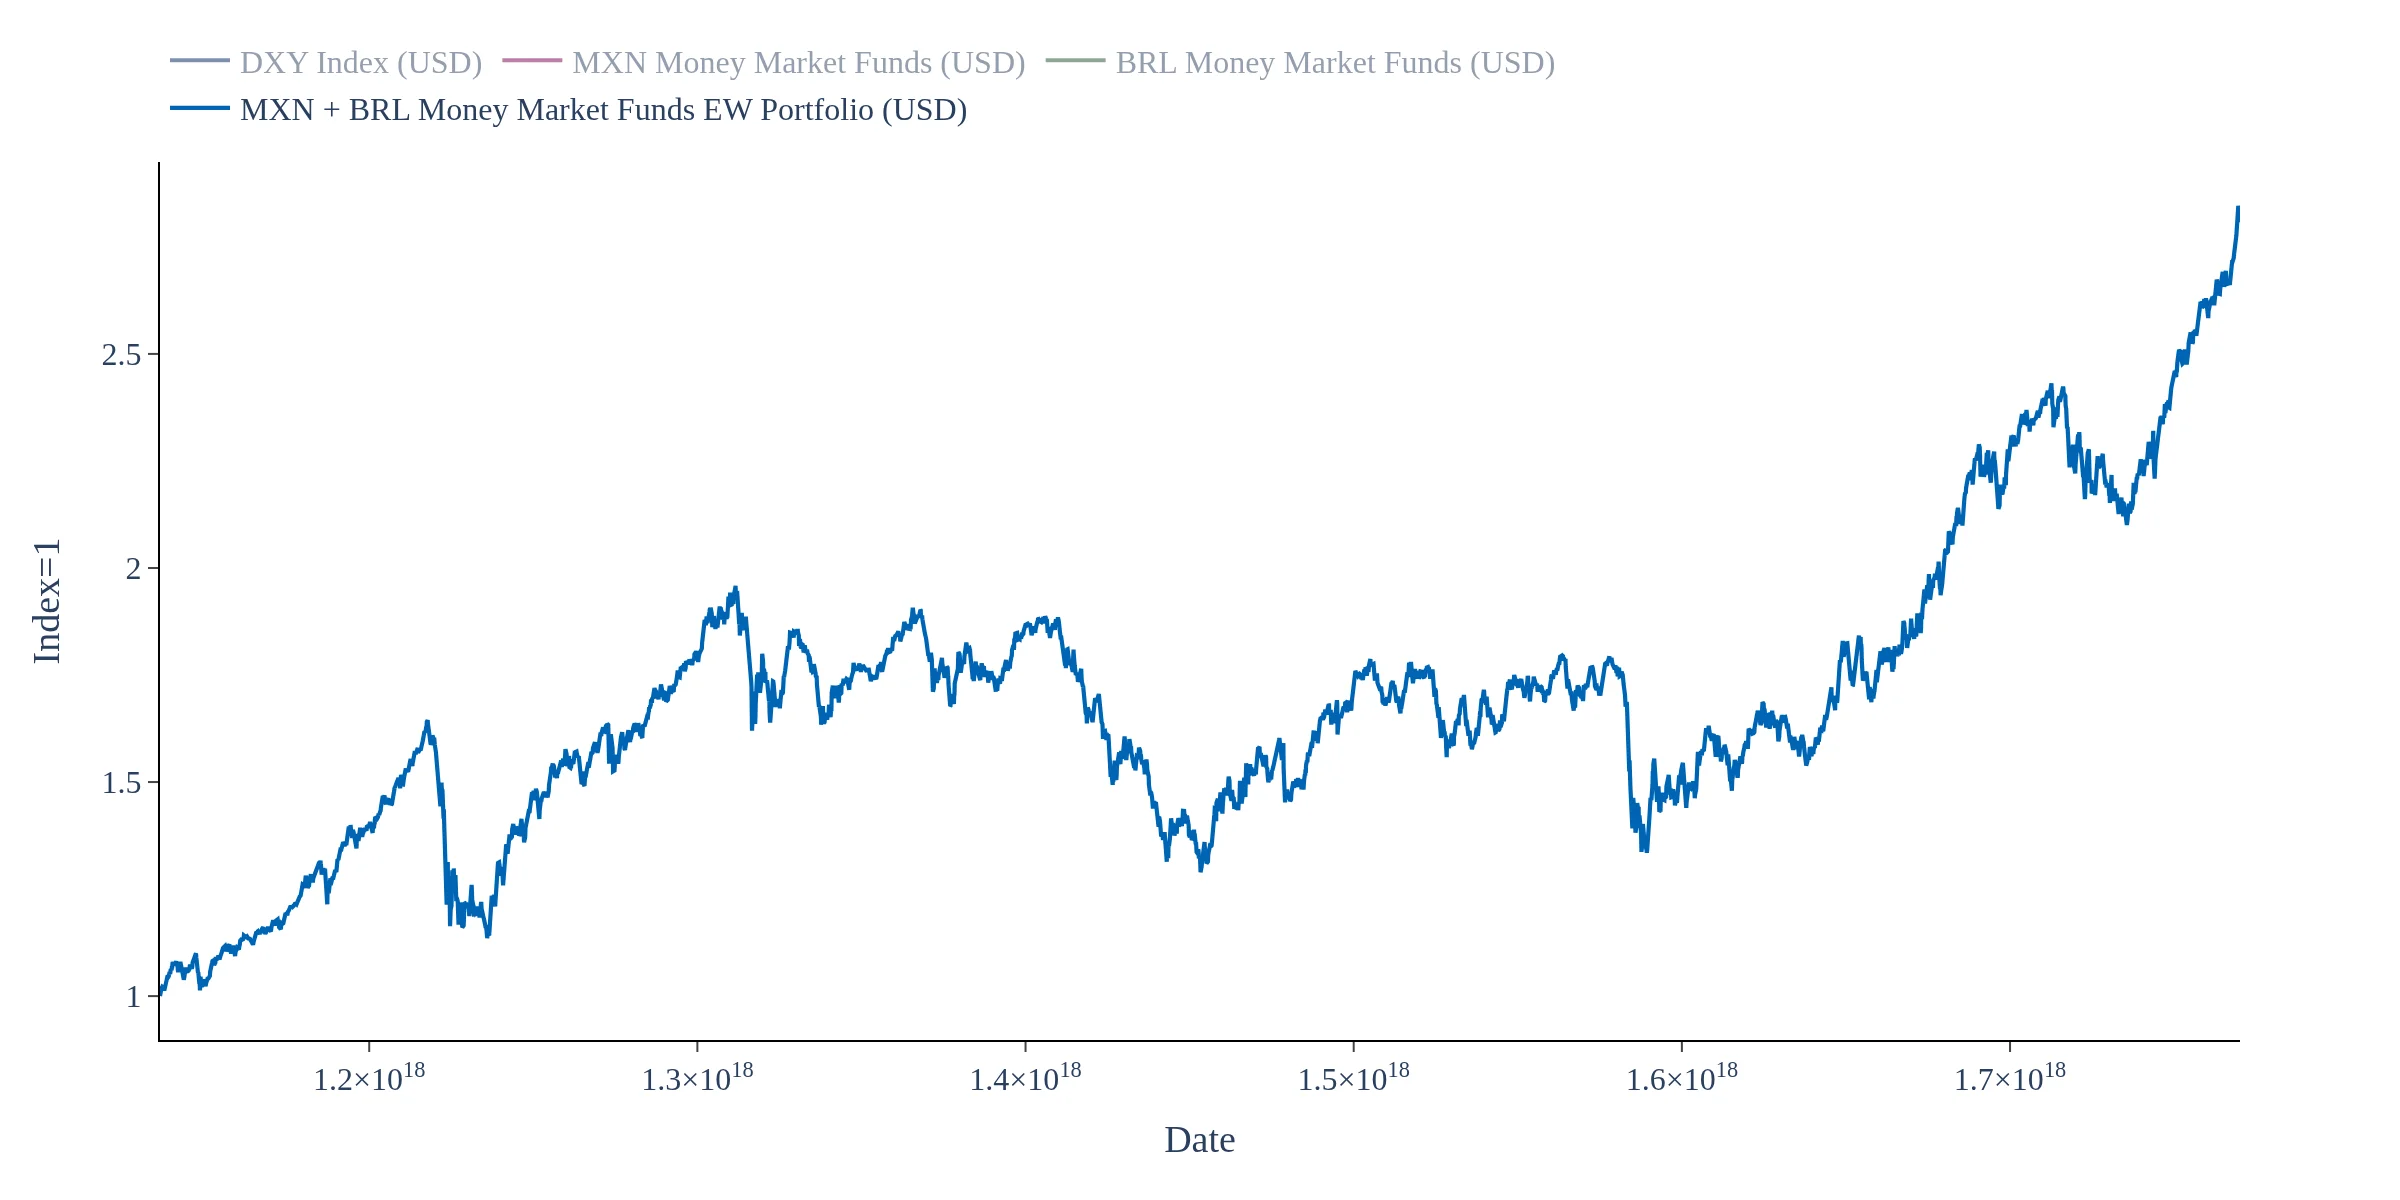
Track the how MXN and BRL money market funds are performing in USD