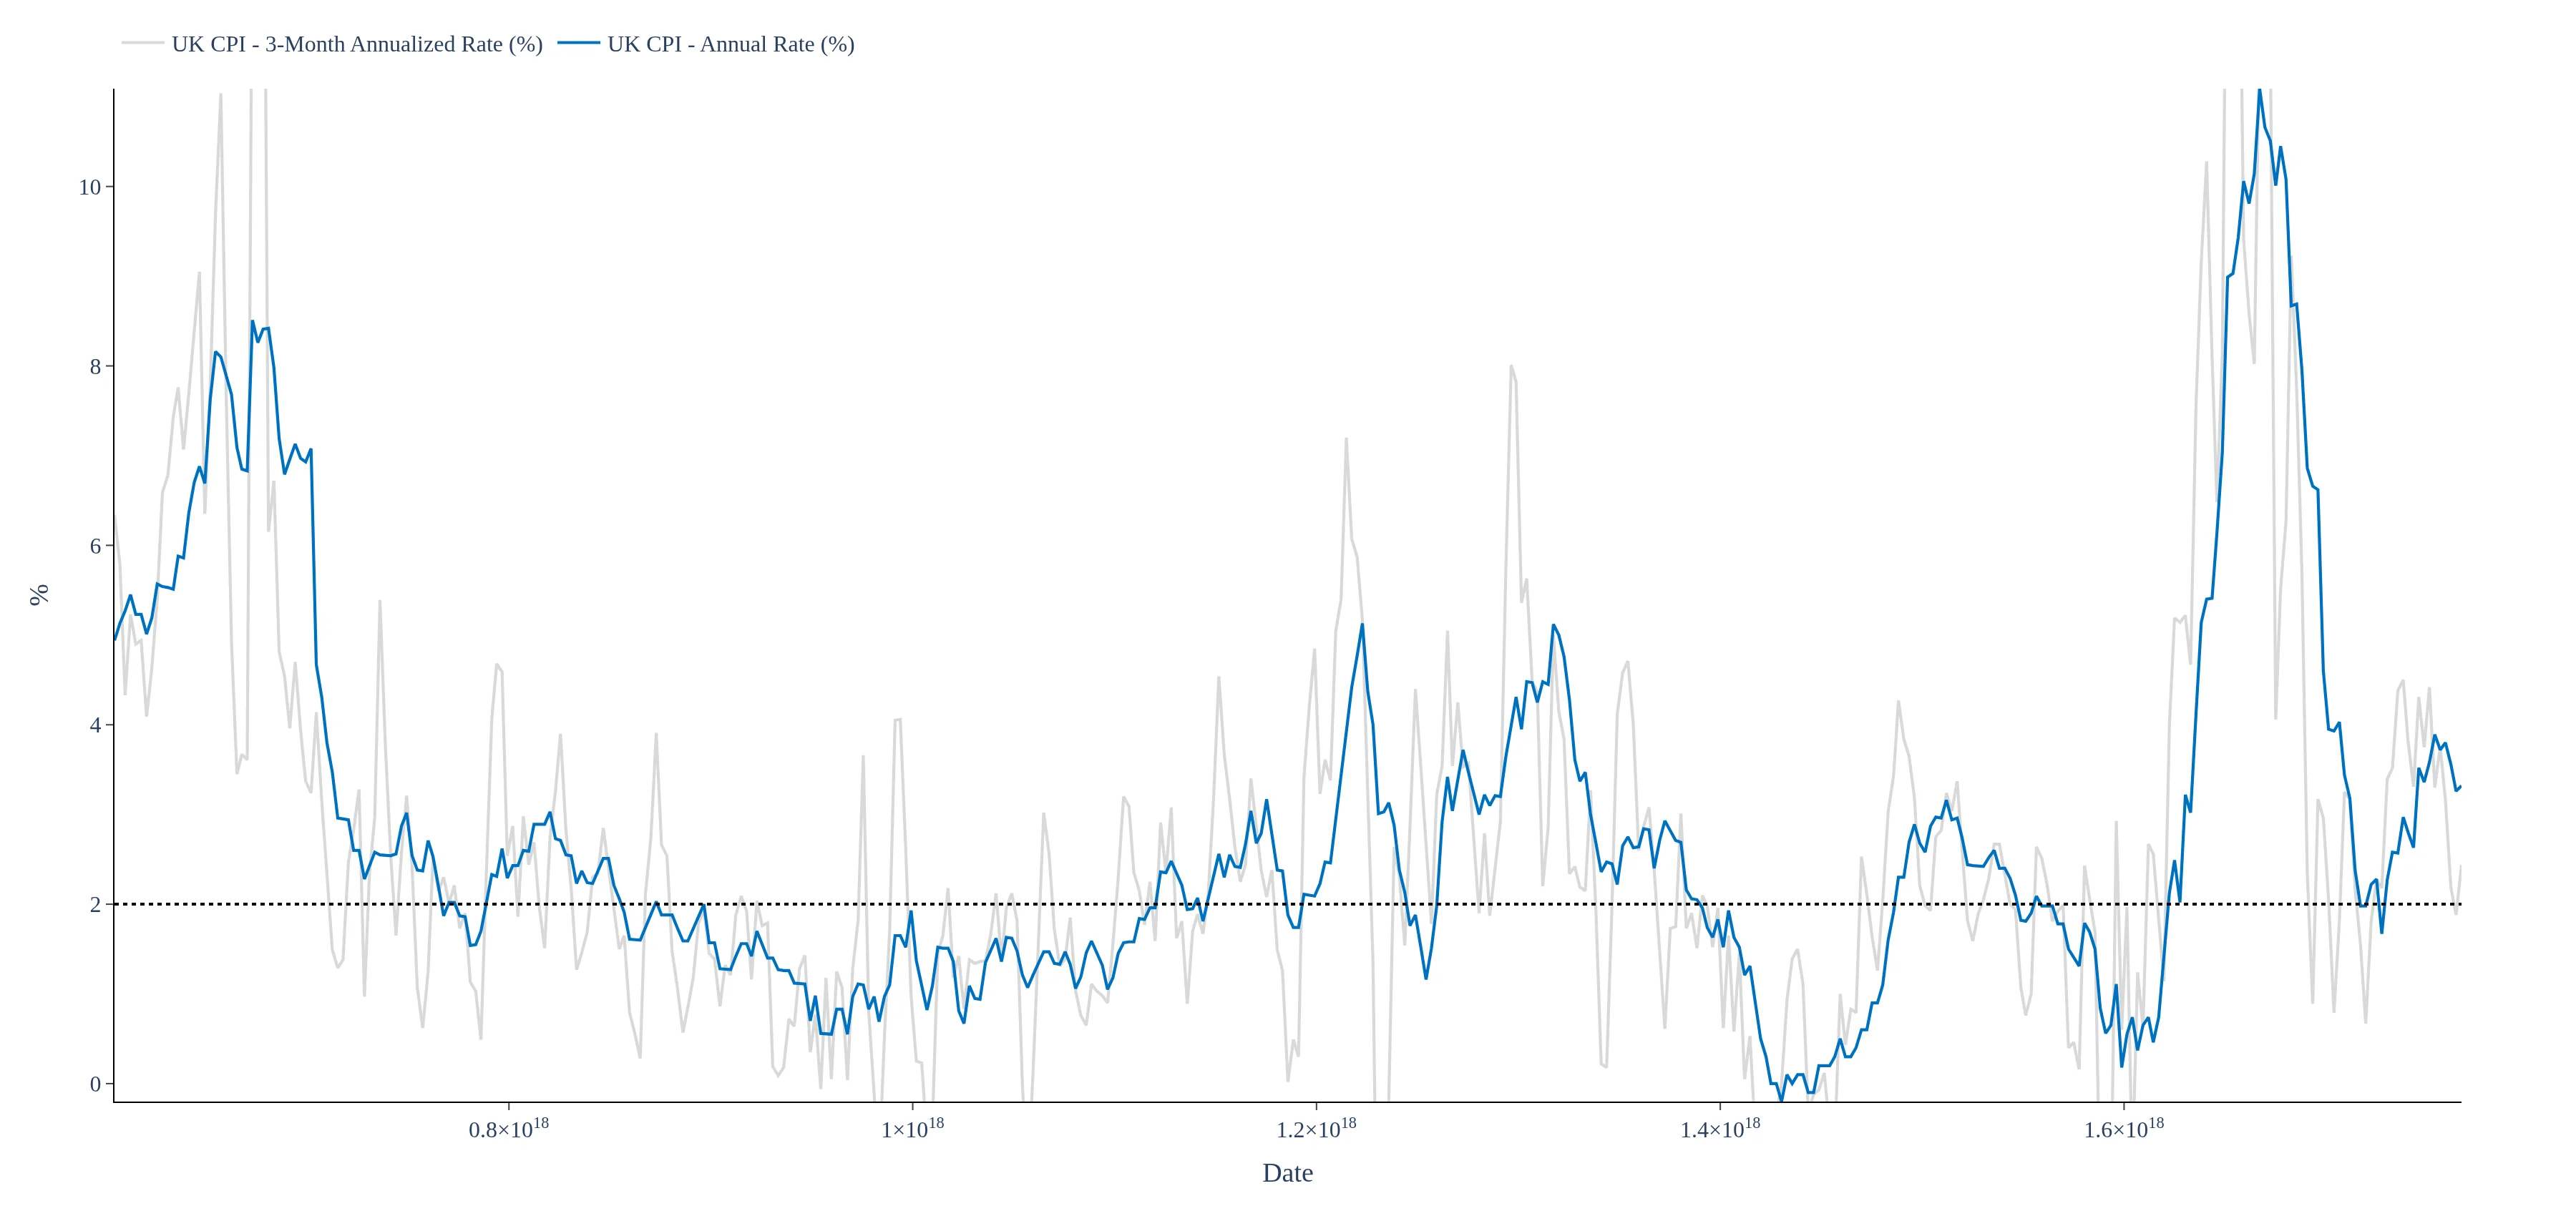
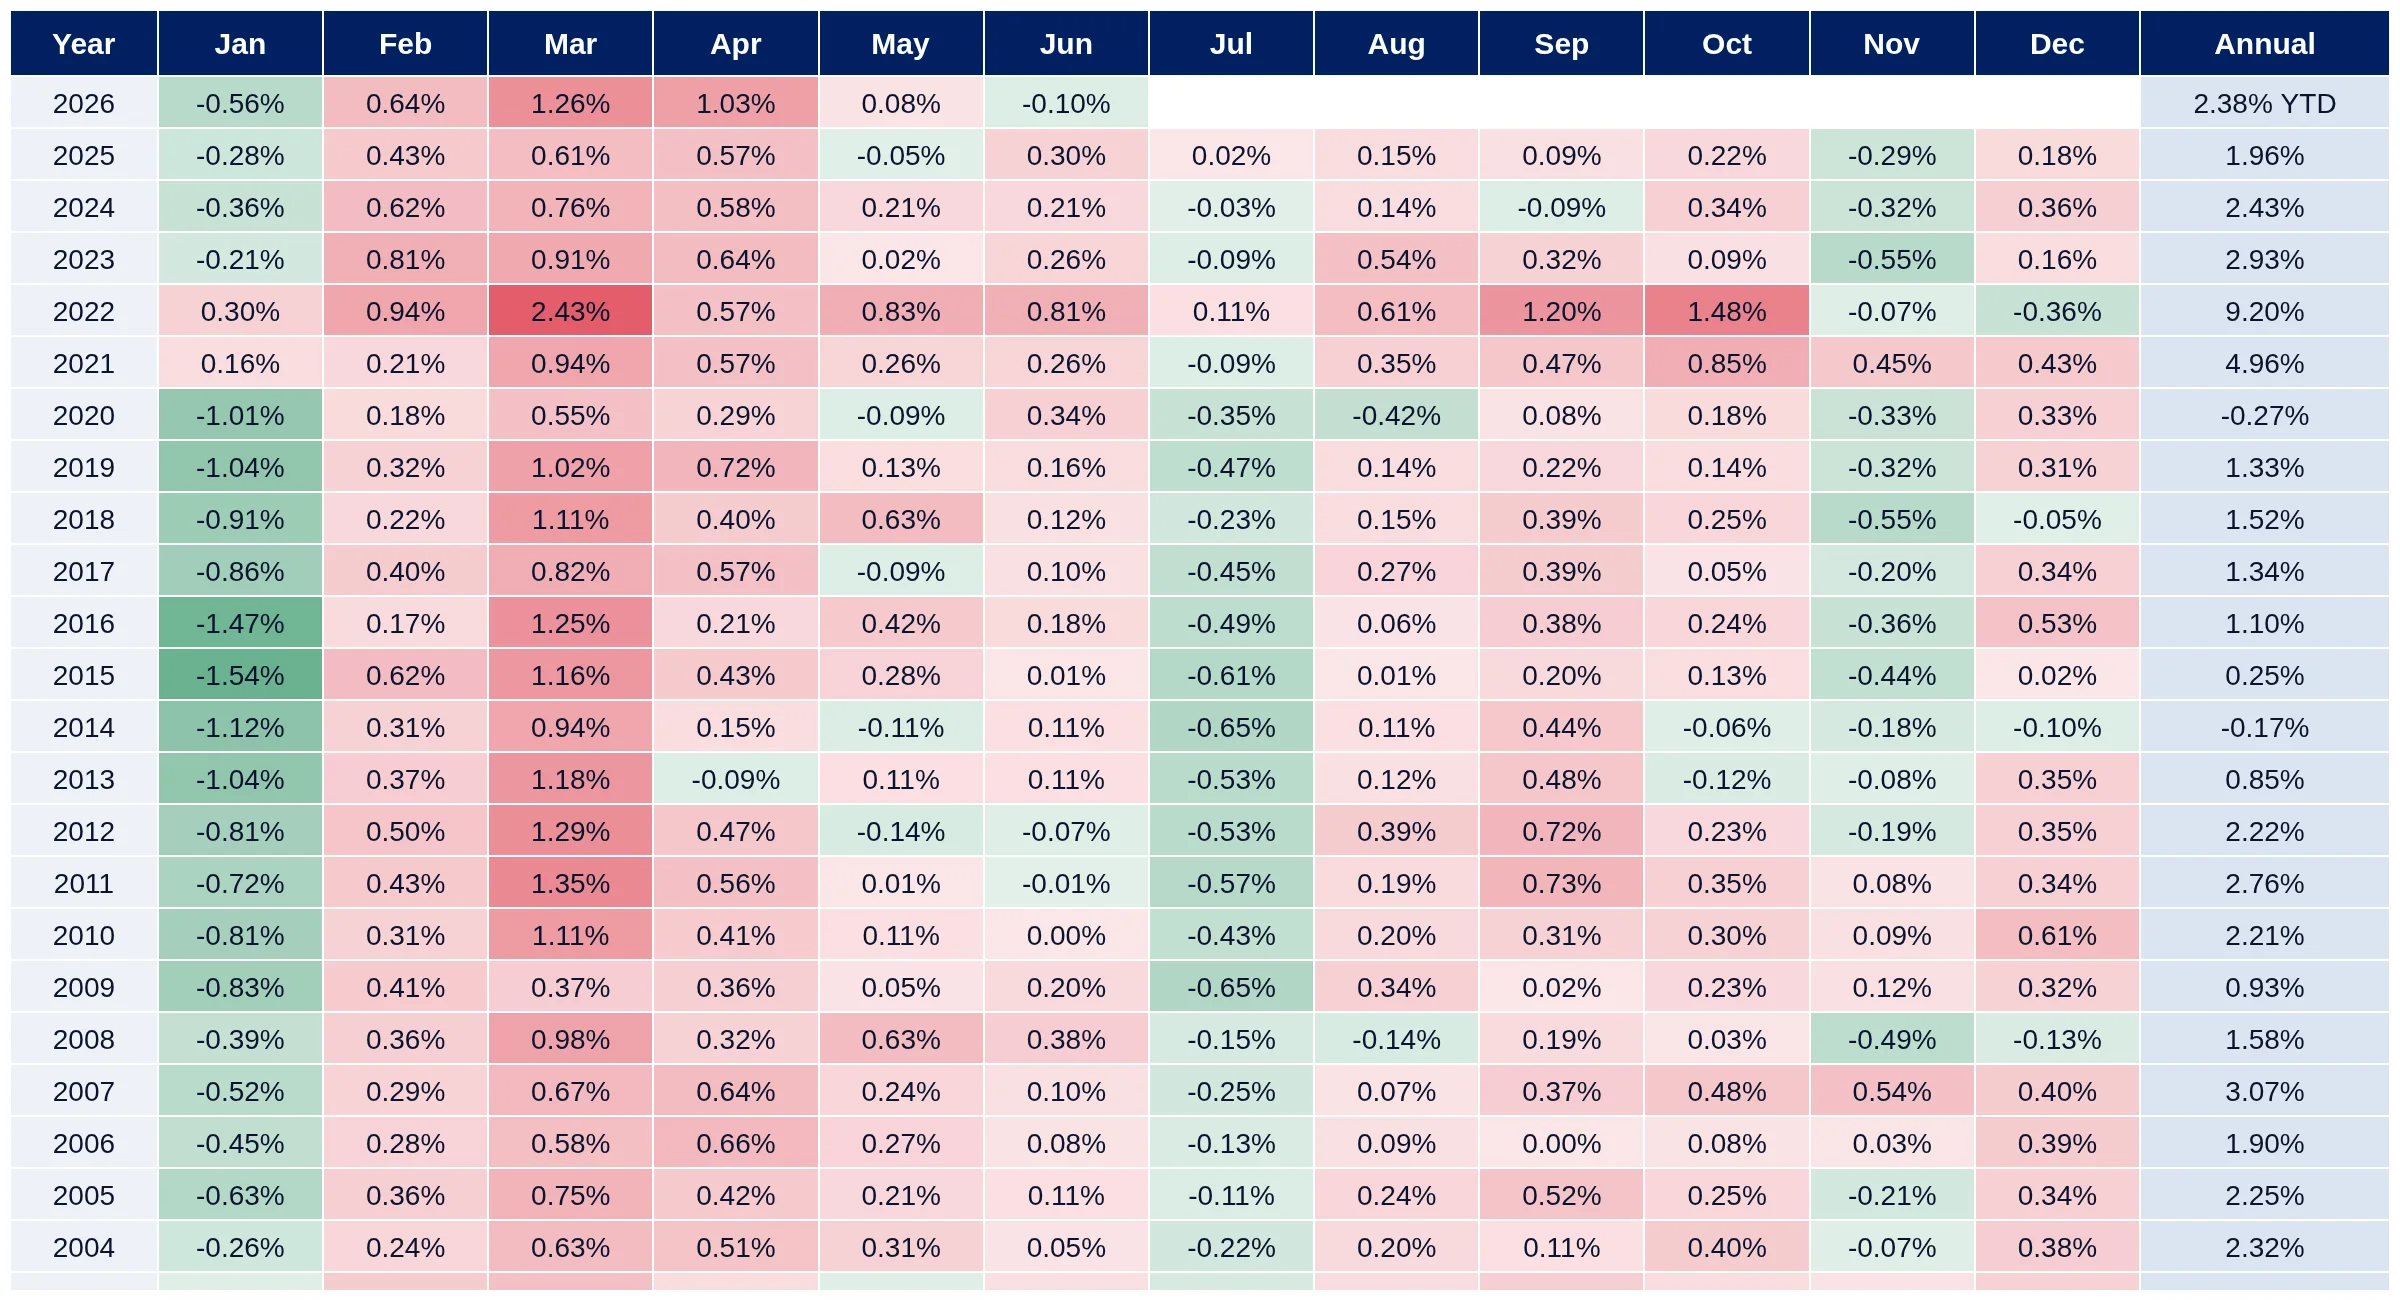
Compare the UK’s annual and monthly CPI inflation rates across years.
This dashboard allows you to compare the UK’s annual inflation rates by year, using the Consumer Price Index (CPI) data published by the Office for National Statistics. You can easily identify trends in inflation over multiple years and assess how economic factors impact the cost of living.
The dashboard calculates monthly inflation as the month-over-month percentage change in the not-seasonally-adjusted UK all-items Consumer Price Index. Annual inflation is derived from the final observation of each calendar year compared to the previous year's final observation, providing a clear view of inflation trends.
The dashboard features separate charts for monthly and annual inflation rates, allowing users to analyze both short-term and long-term trends. Monthly inflation reflects immediate changes, while annual inflation provides a broader perspective on price changes over the year, essential for economic analysis.
Monthly inflation is the month-over-month percentage change in the not-seasonally-adjusted UK all-items Consumer Price Index published by the Office for National Statistics. Annual inflation also uses this NSA index and is calculated from the final available observation in each calendar year to the final observation in the previous year. For an incomplete current year, the latest observation is compared with the previous calendar year's final observation and marked YTD.