How much is your money really worth? See how inflation erodes purchasing power over time.
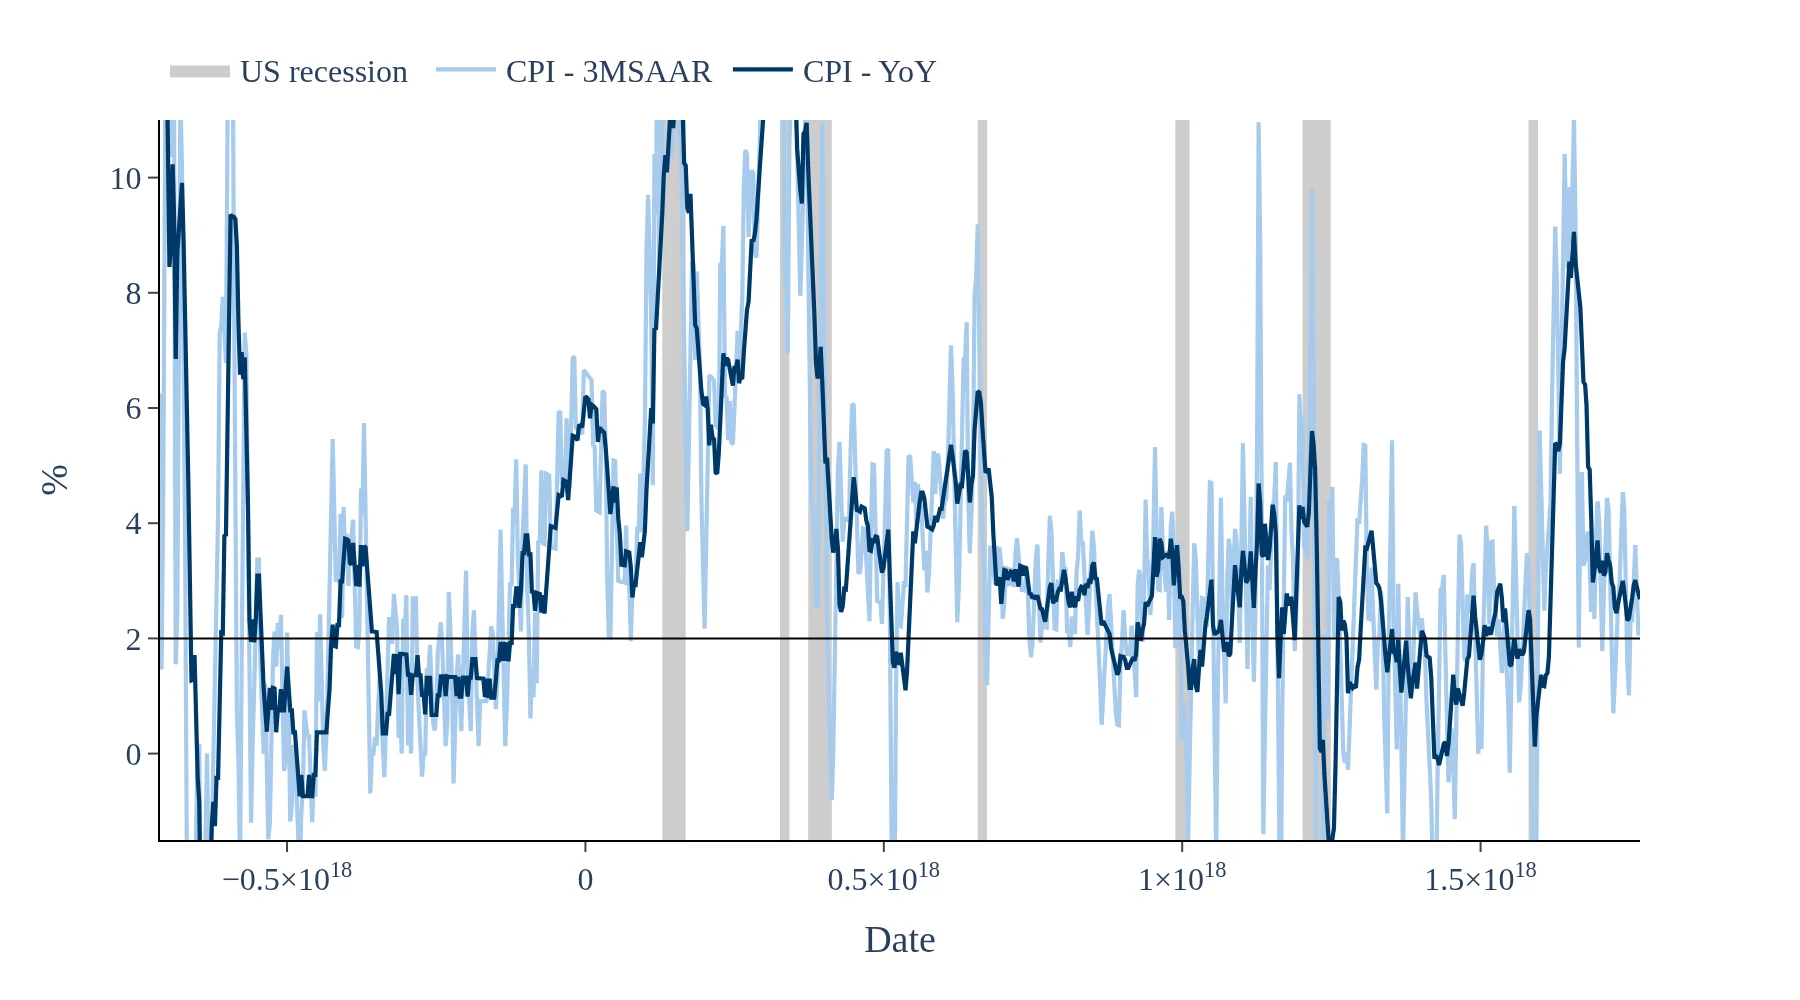
The calculator uses the US CPI-U (Consumer Price Index for All Urban Consumers) published by the Bureau of Labor Statistics to show how the purchasing power of a dollar amount has changed between any two years since 1947.
Small differences can arise from which month's CPI value is used as the base. This calculator uses the January CPI for the selected year. Other tools may use annual averages or a different month, leading to slightly different results.
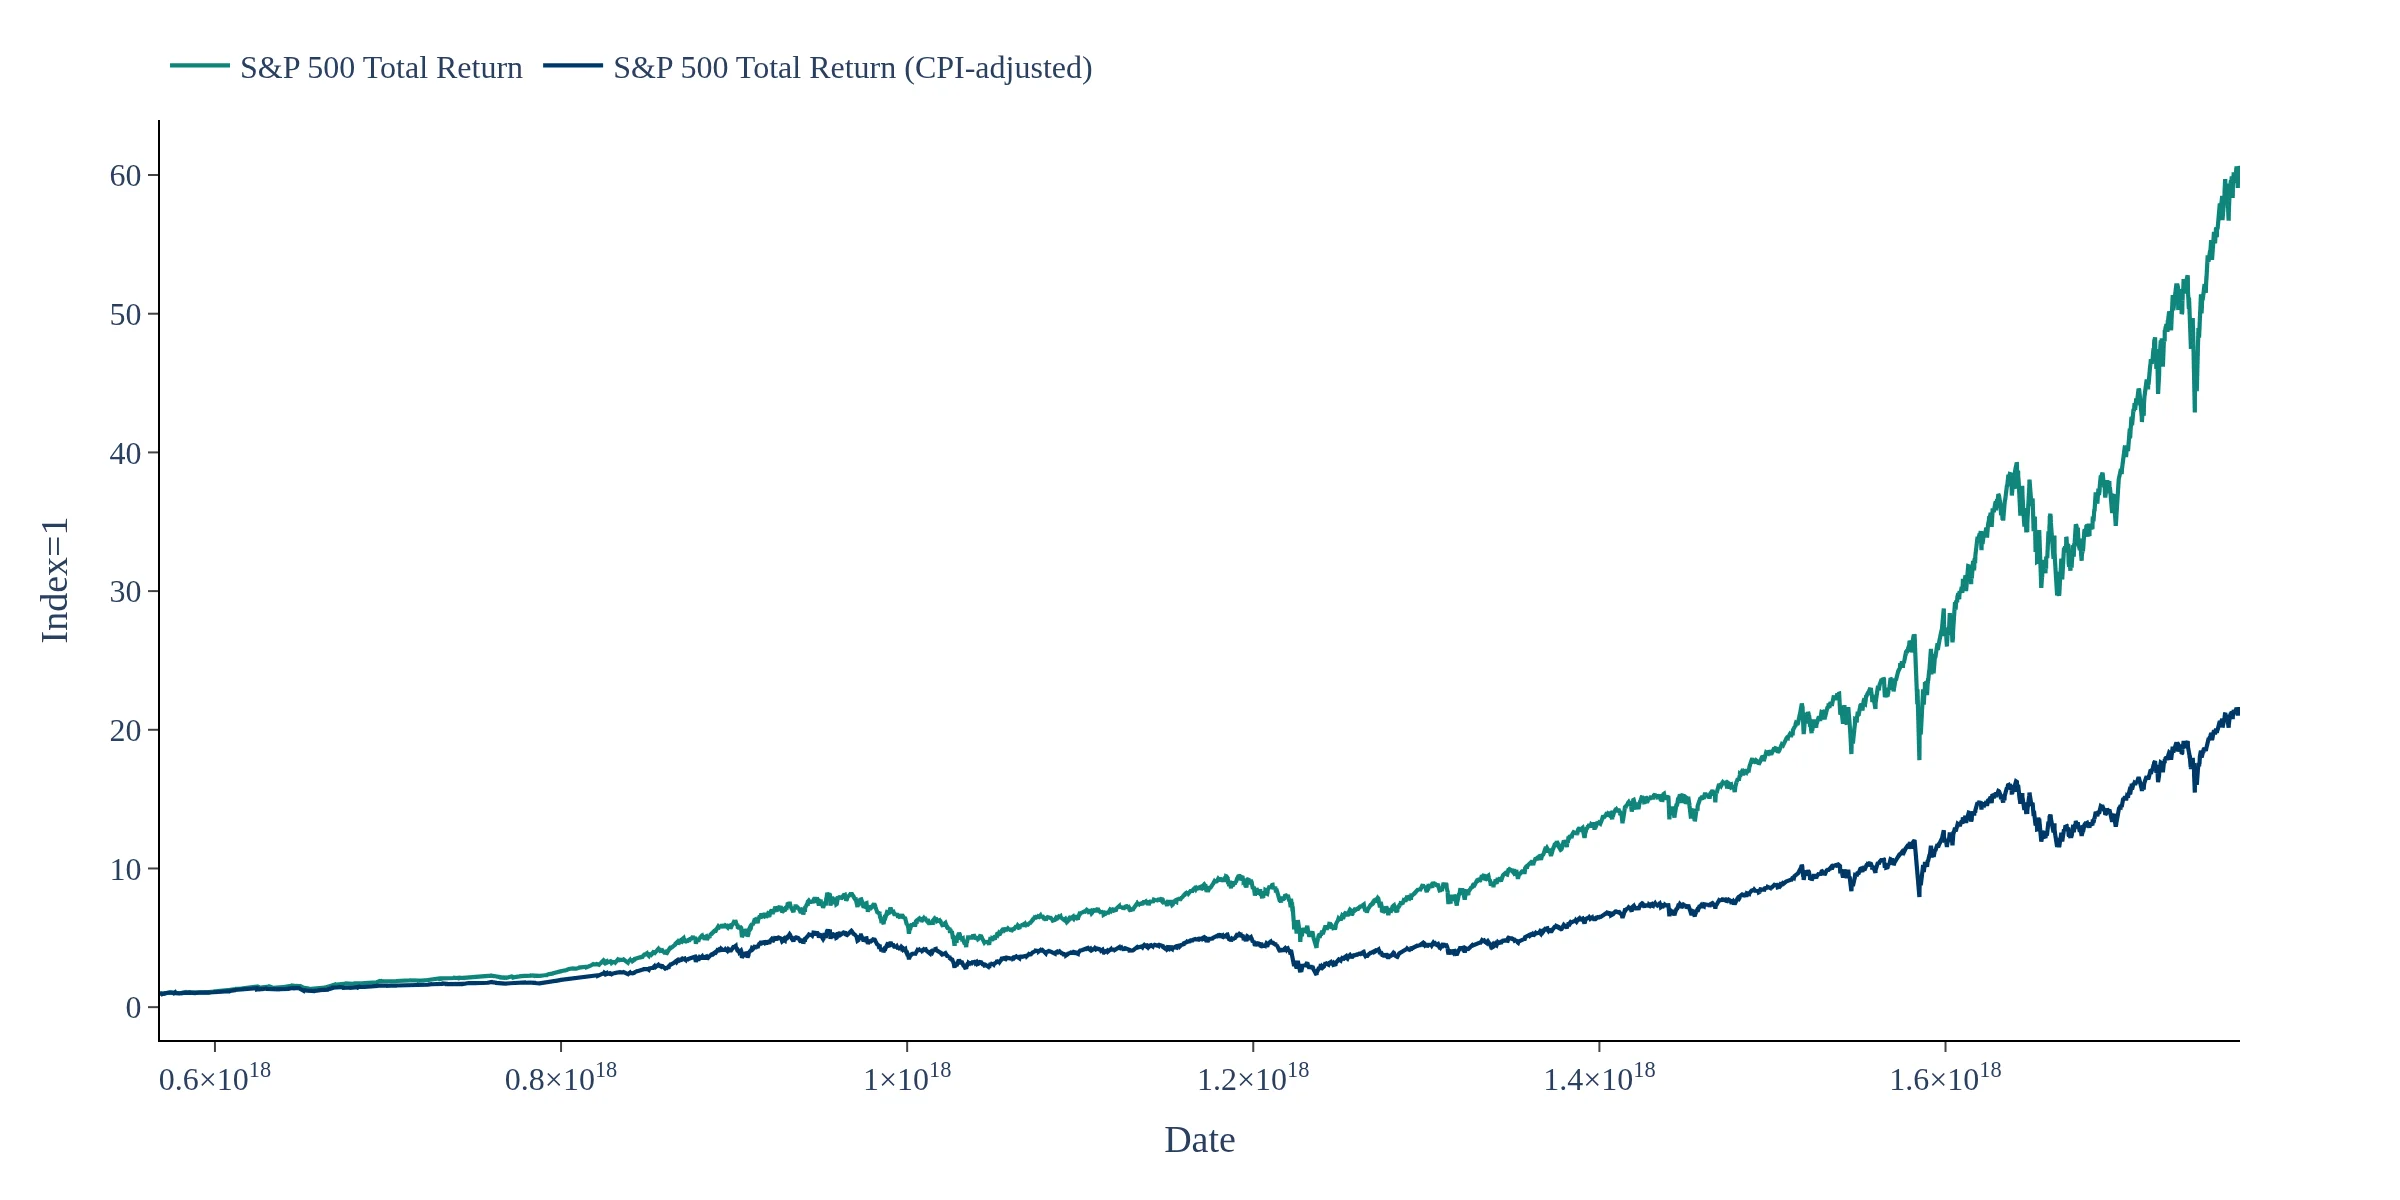
Purchasing power is the amount of goods and services a unit of currency can buy. When inflation rises, each dollar buys less — meaning purchasing power falls. The calculator shows exactly how much of your money's value has been eroded by inflation.
The BLS publishes CPI data monthly, typically around the 10th–15th of each month. This dashboard is updated shortly after each release so the latest data is always reflected.
This calculator uses the US Consumer Price Index for All Urban Consumers (CPI-U), All Items, Not Seasonally Adjusted, published monthly by the US Bureau of Labor Statistics (BLS). The CPI-U measures the average change in prices paid by urban consumers for a representative basket of goods and services. Cumulative inflation is computed as the percentage change in CPI between the January of the selected start year and the most recent available month of the end year. Annualised inflation is the compound annual growth rate of the CPI over the selected period. Purchasing power lost shows how many cents of original value have been eroded by inflation per dollar. Data is updated monthly following each BLS CPI release.