Dashboard consolidating the most relevant information pieces inside the US CPI data. Source: BLS — updated monthly.
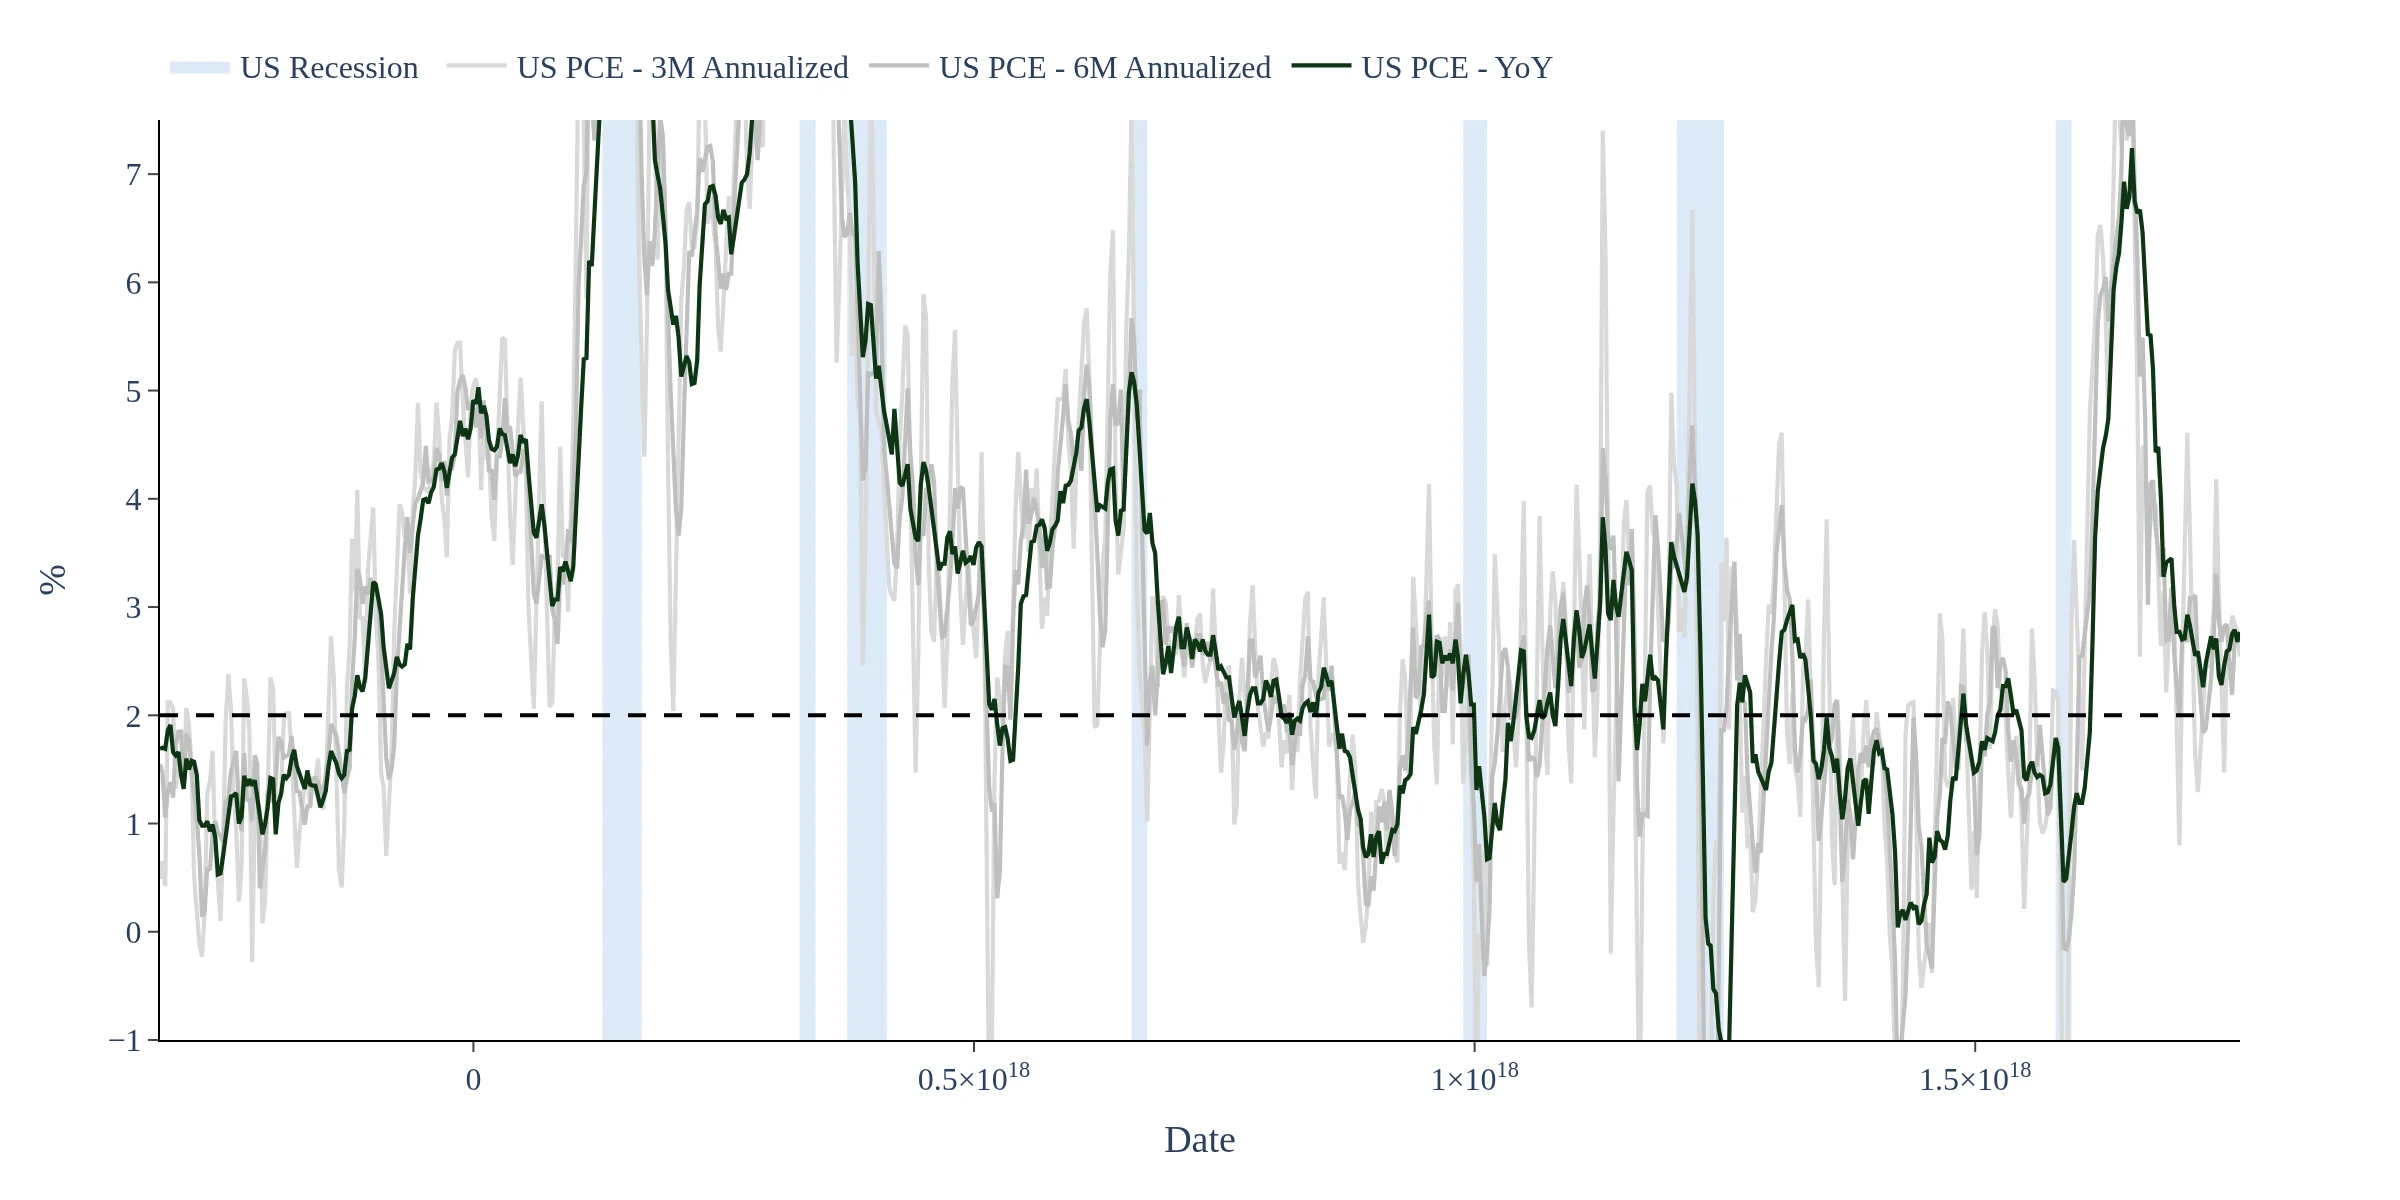
The US CPI Dashboard consolidates key data from the Bureau of Labor Statistics (BLS) to analyze monthly Consumer Price Index (CPI) inflation. It provides insights into headline CPI and core CPI, along with detailed breakdowns by category, allowing investors to monitor inflation trends and identify turning points in price pressures.
The US CPI Dashboard highlights various components driving inflation, including shelter, services, and goods. By breaking down core CPI and core services CPI, the dashboard allows users to understand which sectors are contributing to inflation or disinflation over time.
Data on the US CPI Dashboard is updated monthly, following the release of the latest CPI figures by the Bureau of Labor Statistics. This ensures that investors have access to the most current economic data for informed decision-making regarding inflation and price trends.
This dashboard analyzes US CPI (Consumer Price Index) inflation using monthly data published by the Bureau of Labor Statistics (BLS). It tracks headline CPI and core CPI, plus detailed category breakdowns to show which components are driving inflation and disinflation over time. The dashboard also highlights seasonality patterns and compares inflation across key sectors such as shelter, services and goods. Data is updated after each monthly CPI release and organized for fast, investor-focused interpretation. Use it to monitor inflation trends, turning points and the underlying composition of US price pressures.