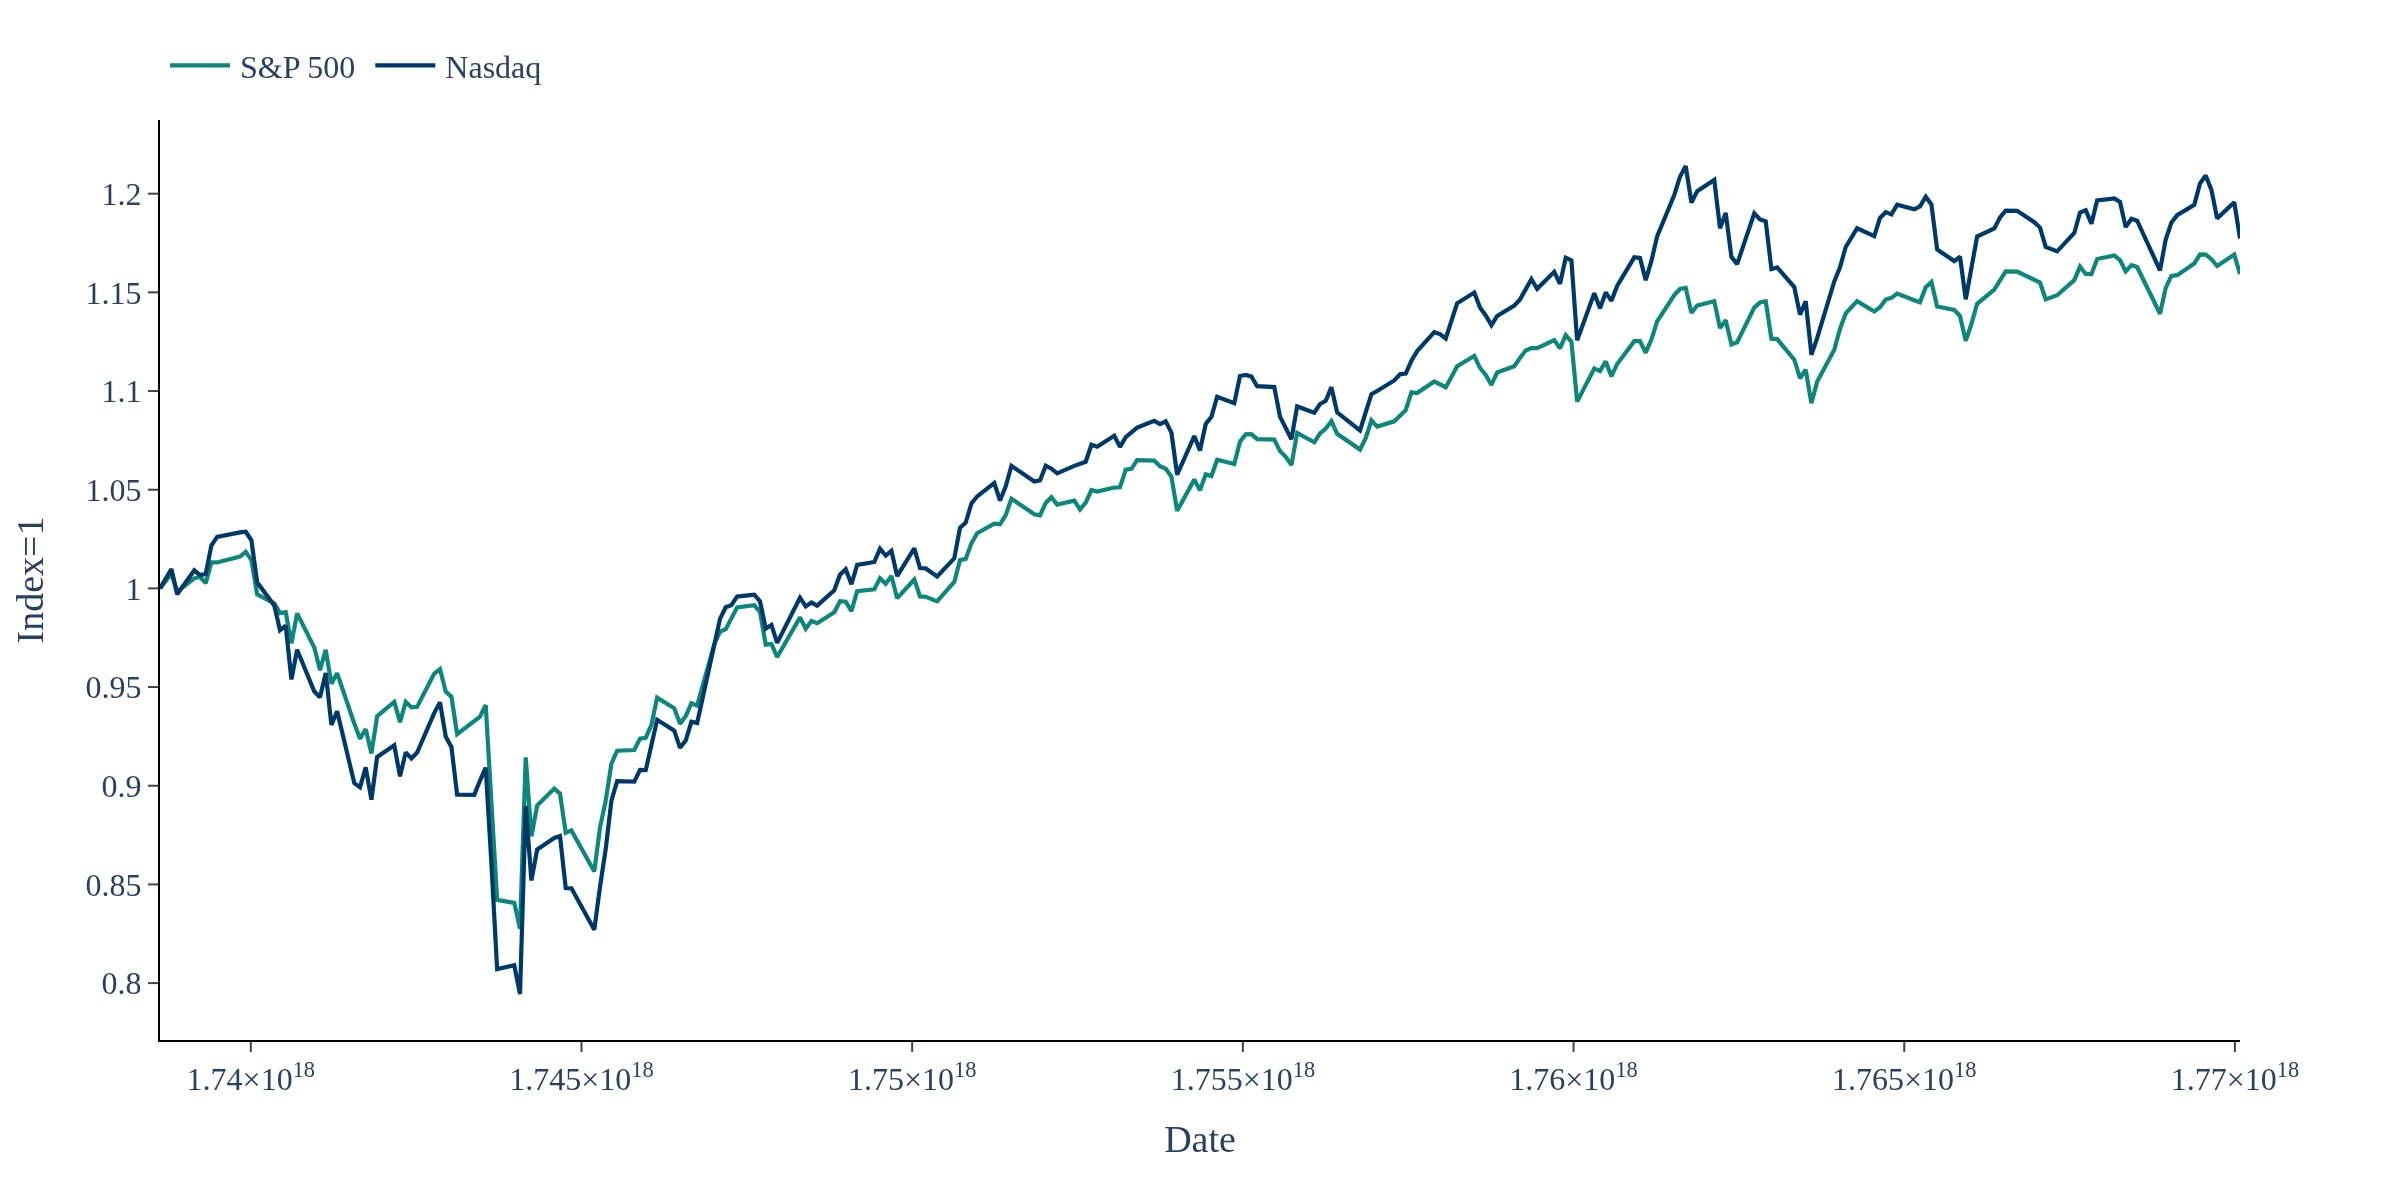
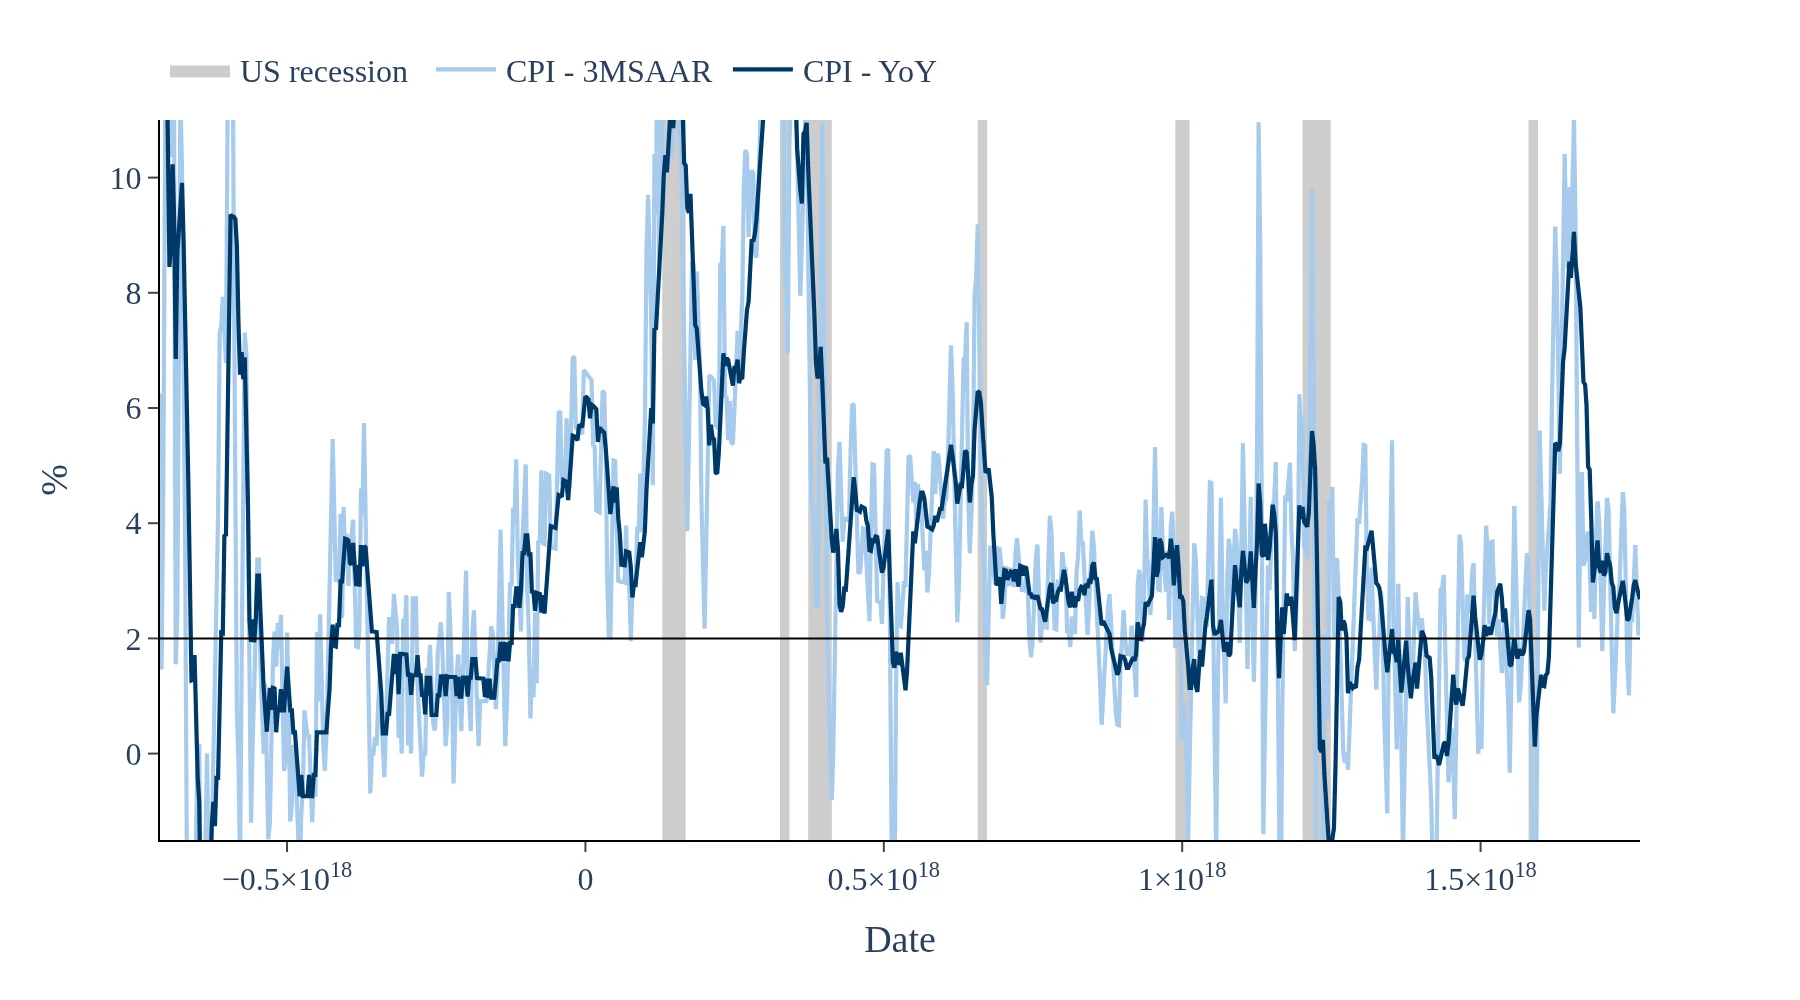
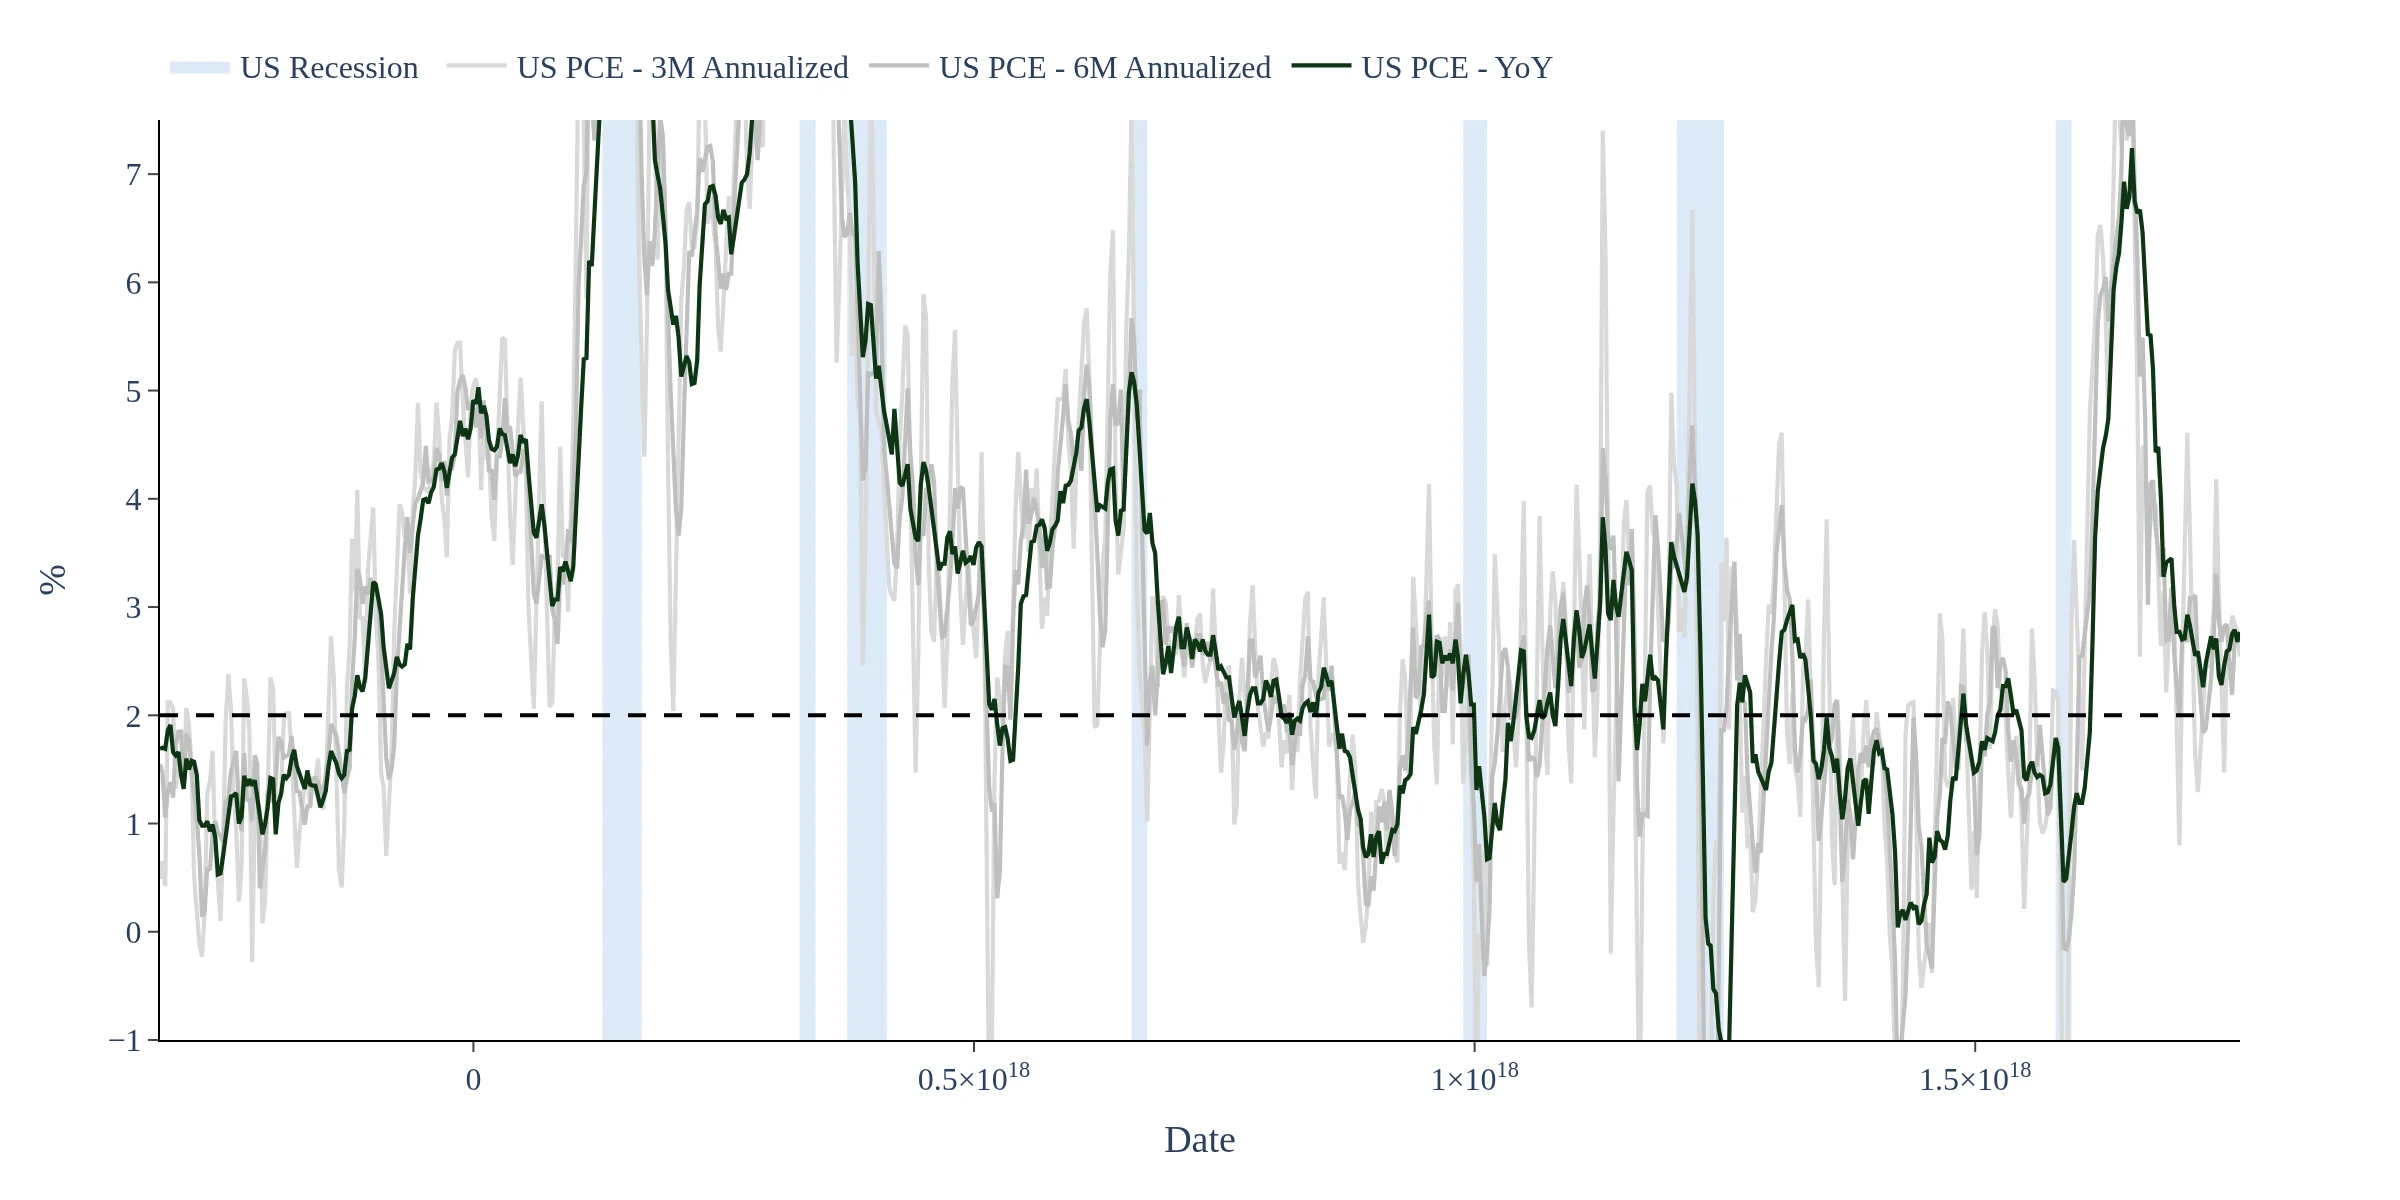
The S&P 500 CPI-Adjusted Total Return dashboard provides a clear comparison between nominal S&P 500 returns and inflation-adjusted returns. By incorporating US CPI inflation data, it reveals how inflation impacts purchasing power and highlights periods when real returns exceed nominal gains, making it a valuable tool for evaluating equity wealth creation.
This dashboard allows investors to see how inflation affects S&P 500 performance over time by adjusting nominal returns for CPI changes. It highlights critical periods where inflation erodes investment gains, helping analysts and traders make informed decisions regarding stock investments in relation to inflation trends.
Yes, the S&P 500 CPI-Adjusted Total Return dashboard provides long-term historical context, allowing investors to assess the interaction between stocks and inflation over various market regimes. This analysis can inform strategic investment decisions by illustrating how real returns have evolved relative to inflation.
This dashboard compares the S&P 500 with a CPI-adjusted (inflation-adjusted) version to show how US equity performance looks in real purchasing-power terms. It uses S&P 500 price/total return data alongside US CPI inflation data to convert nominal index levels into real values over time. The chart highlights periods when inflation erodes gains and when real returns meaningfully outpace price growth. Data is updated with the latest available market and CPI observations and displayed with long-term historical context. Use it to evaluate real equity wealth creation, regime shifts and the interaction between stocks and inflation.