Interactive chart showing net worth accumulation from investing a constant amount of dollars monthly at the start of every year.
The Investing Net Worth Simulator calculates potential net worth growth by tracking the accumulation of wealth from investing a fixed monthly amount at the beginning of each year. It utilizes historical performance data from various asset classes, including the S&P 500, gold, and T-bills, to provide users with a visual representation of long-term investment outcomes.
The Investing Net Worth Simulator includes several asset classes such as the S&P 500, gold, and T-bills. This diverse selection allows investors to compare the historical performance and potential net worth accumulation of different investment strategies over time.
Data in the Investing Net Worth Simulator is updated quarterly to reflect the latest performance metrics and economic conditions. This ensures that users have access to current information for making informed investment decisions based on historical trends.
The Investing Net Worth Simulator tracks the accumulation of net worth from investing a fixed monthly amount at the beginning of each year across various asset classes, including the S&P 500, gold, and T-bills. Data is sourced from reputable financial markets and updated quarterly to reflect the latest performance metrics and economic conditions. Users can interpret the interactive charts to visualize potential net worth growth over time, allowing for informed investment decisions based on historical trends in equities and alternative assets. This dashboard serves as a valuable tool for investors seeking to understand the long-term impact of consistent investing on wealth accumulation.
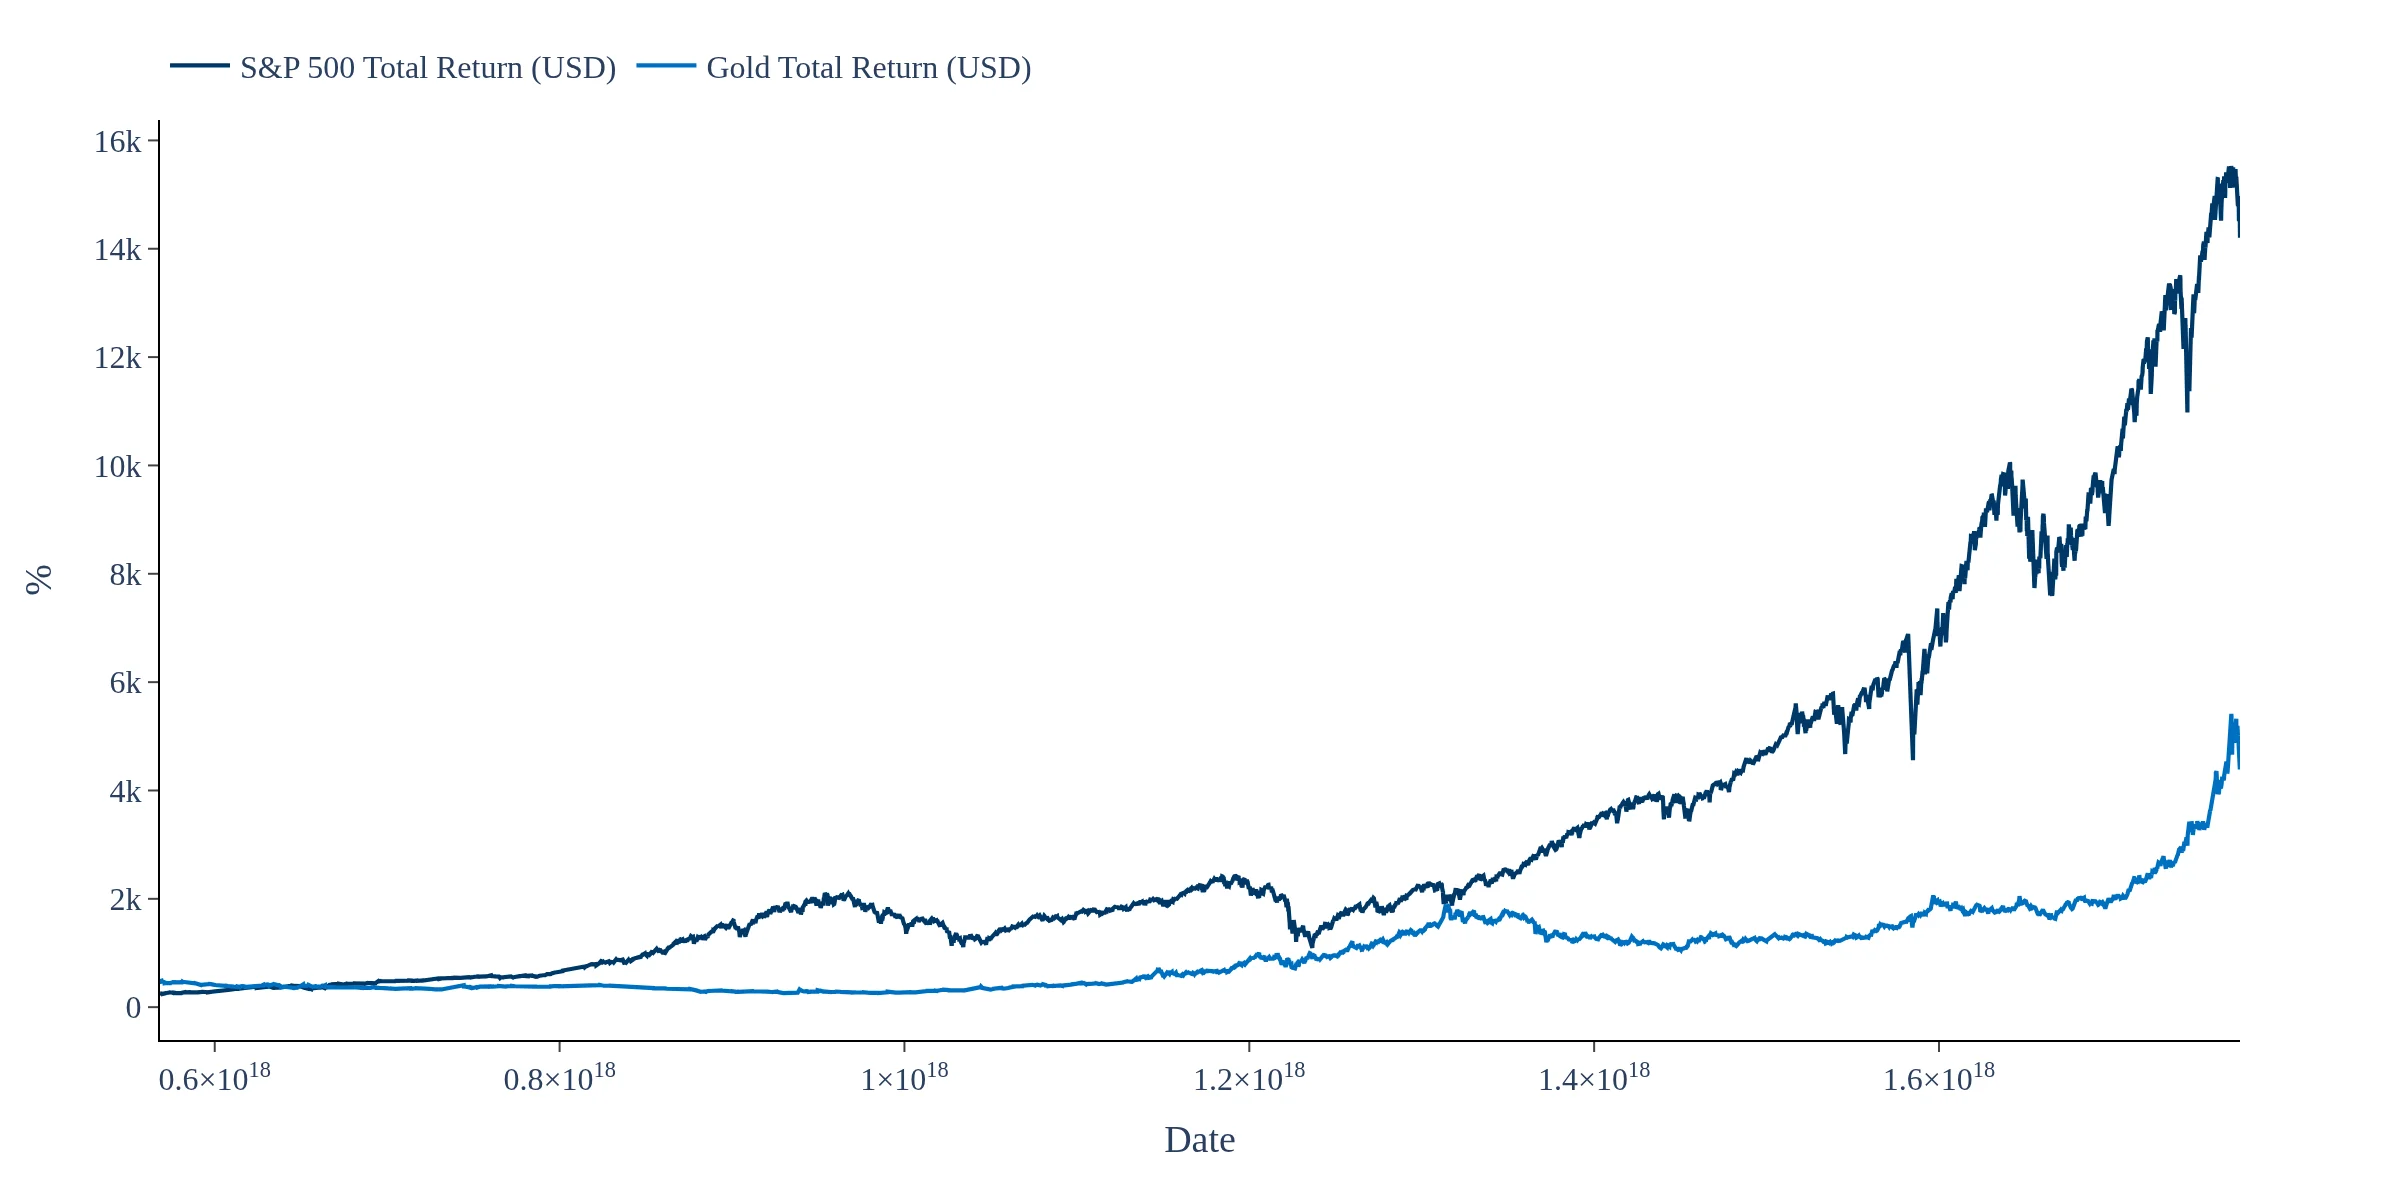
Compare total returns for the S&P 500 and Gold across multiple horizons
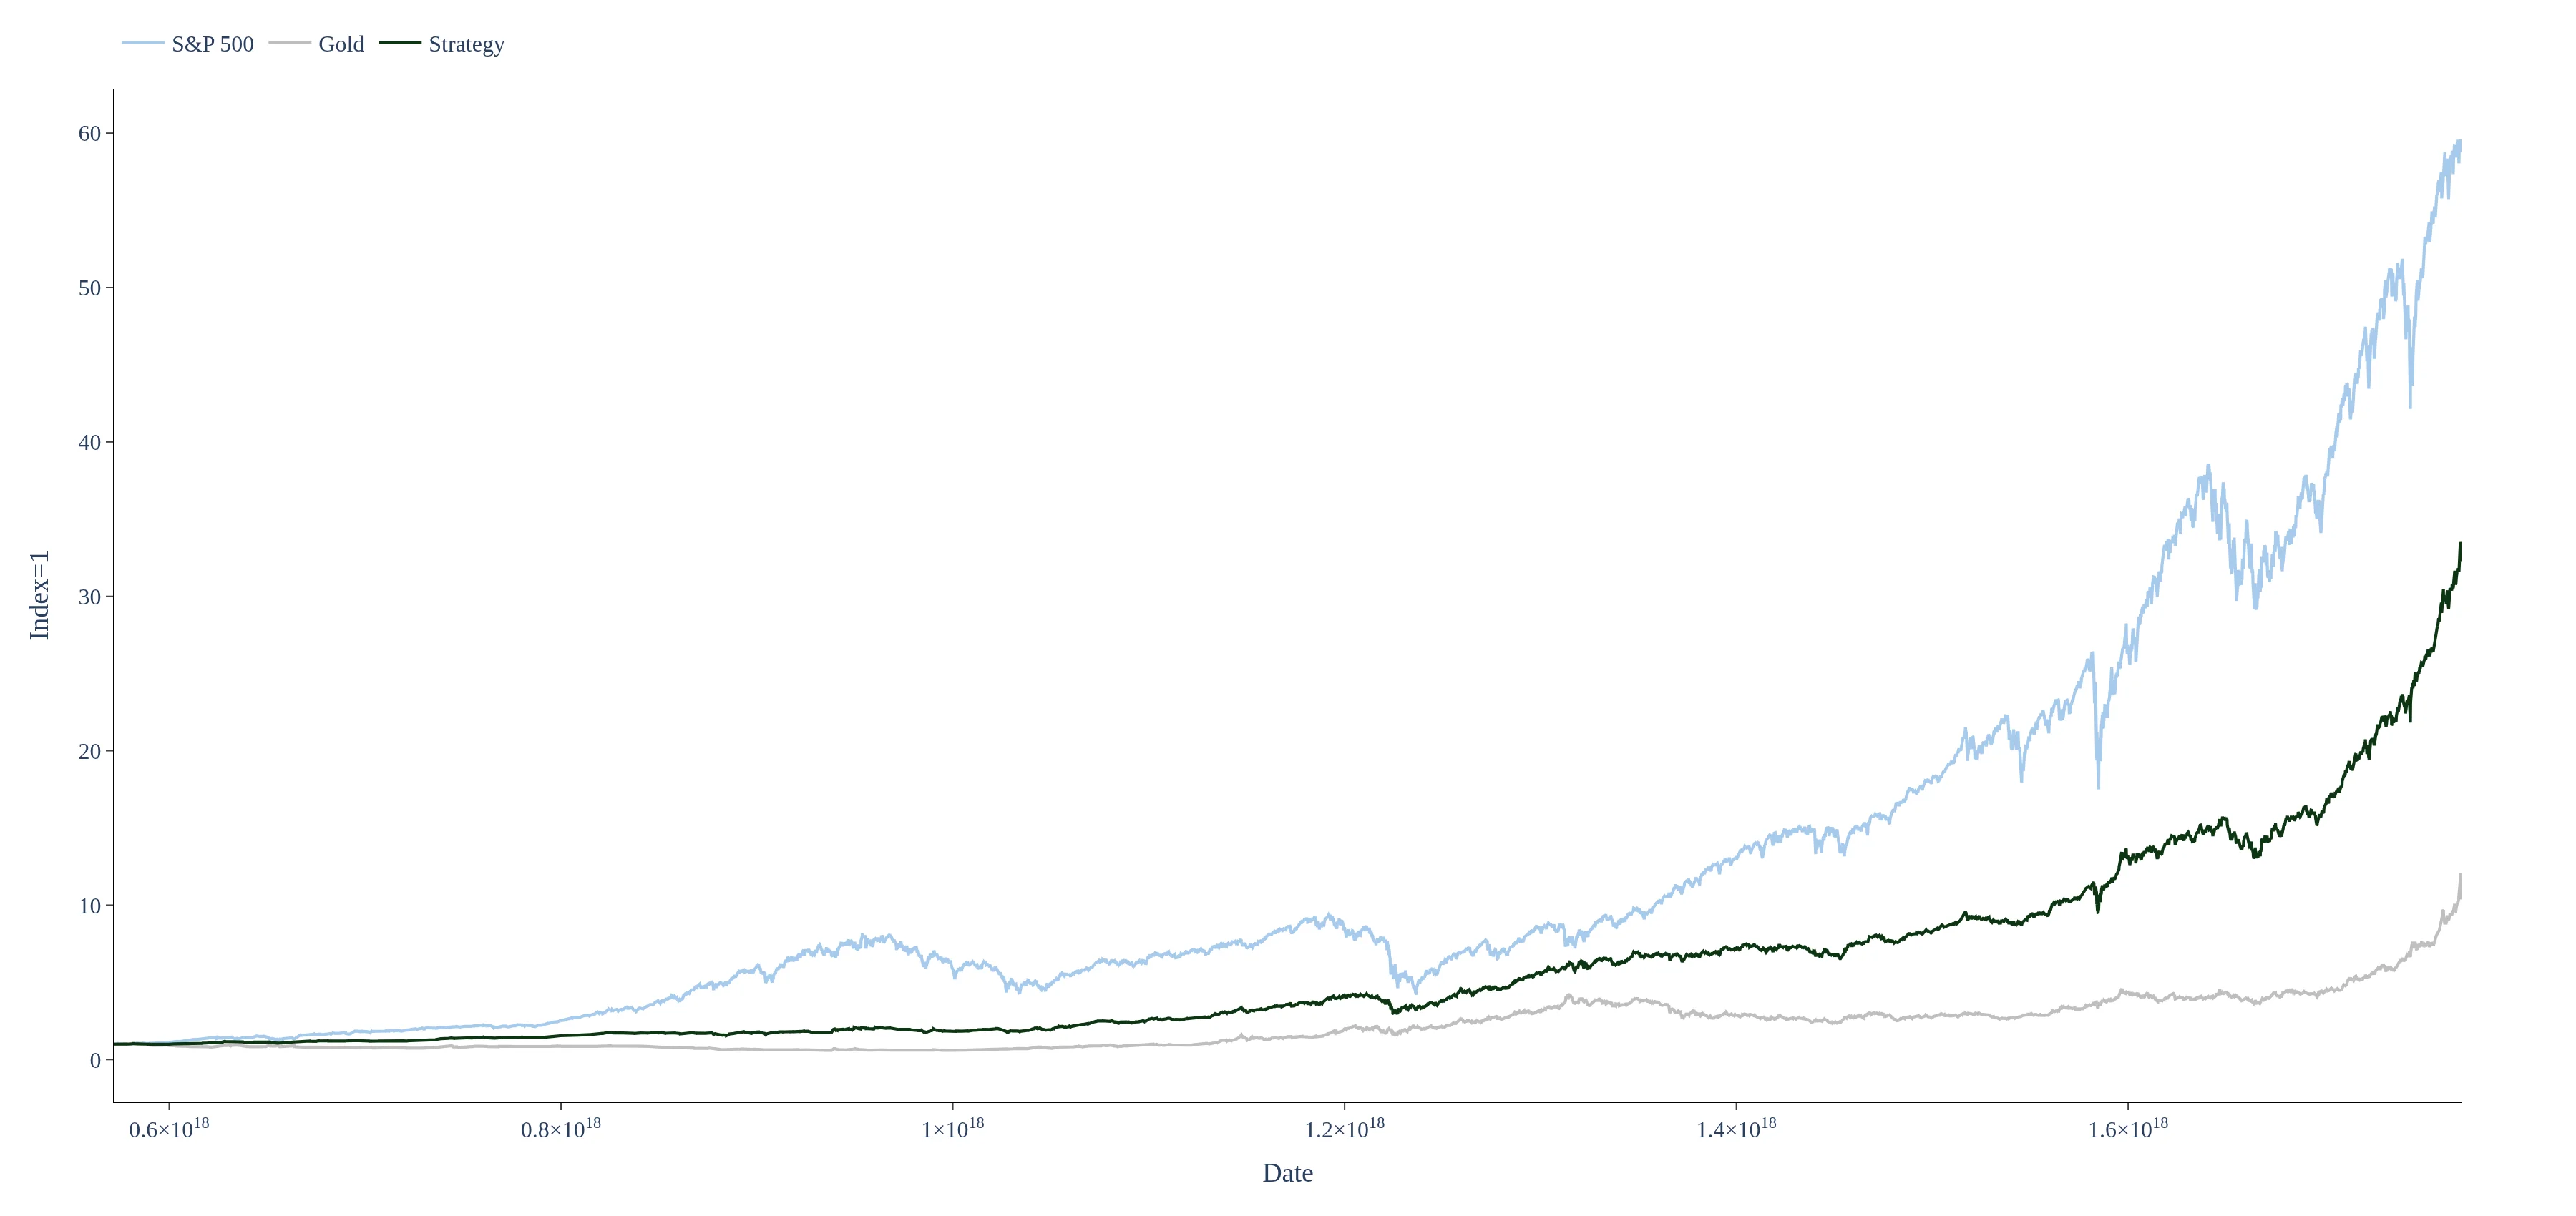
Get insights into how being long the S&P 500 and Gold on a vol adjusted basis is performing
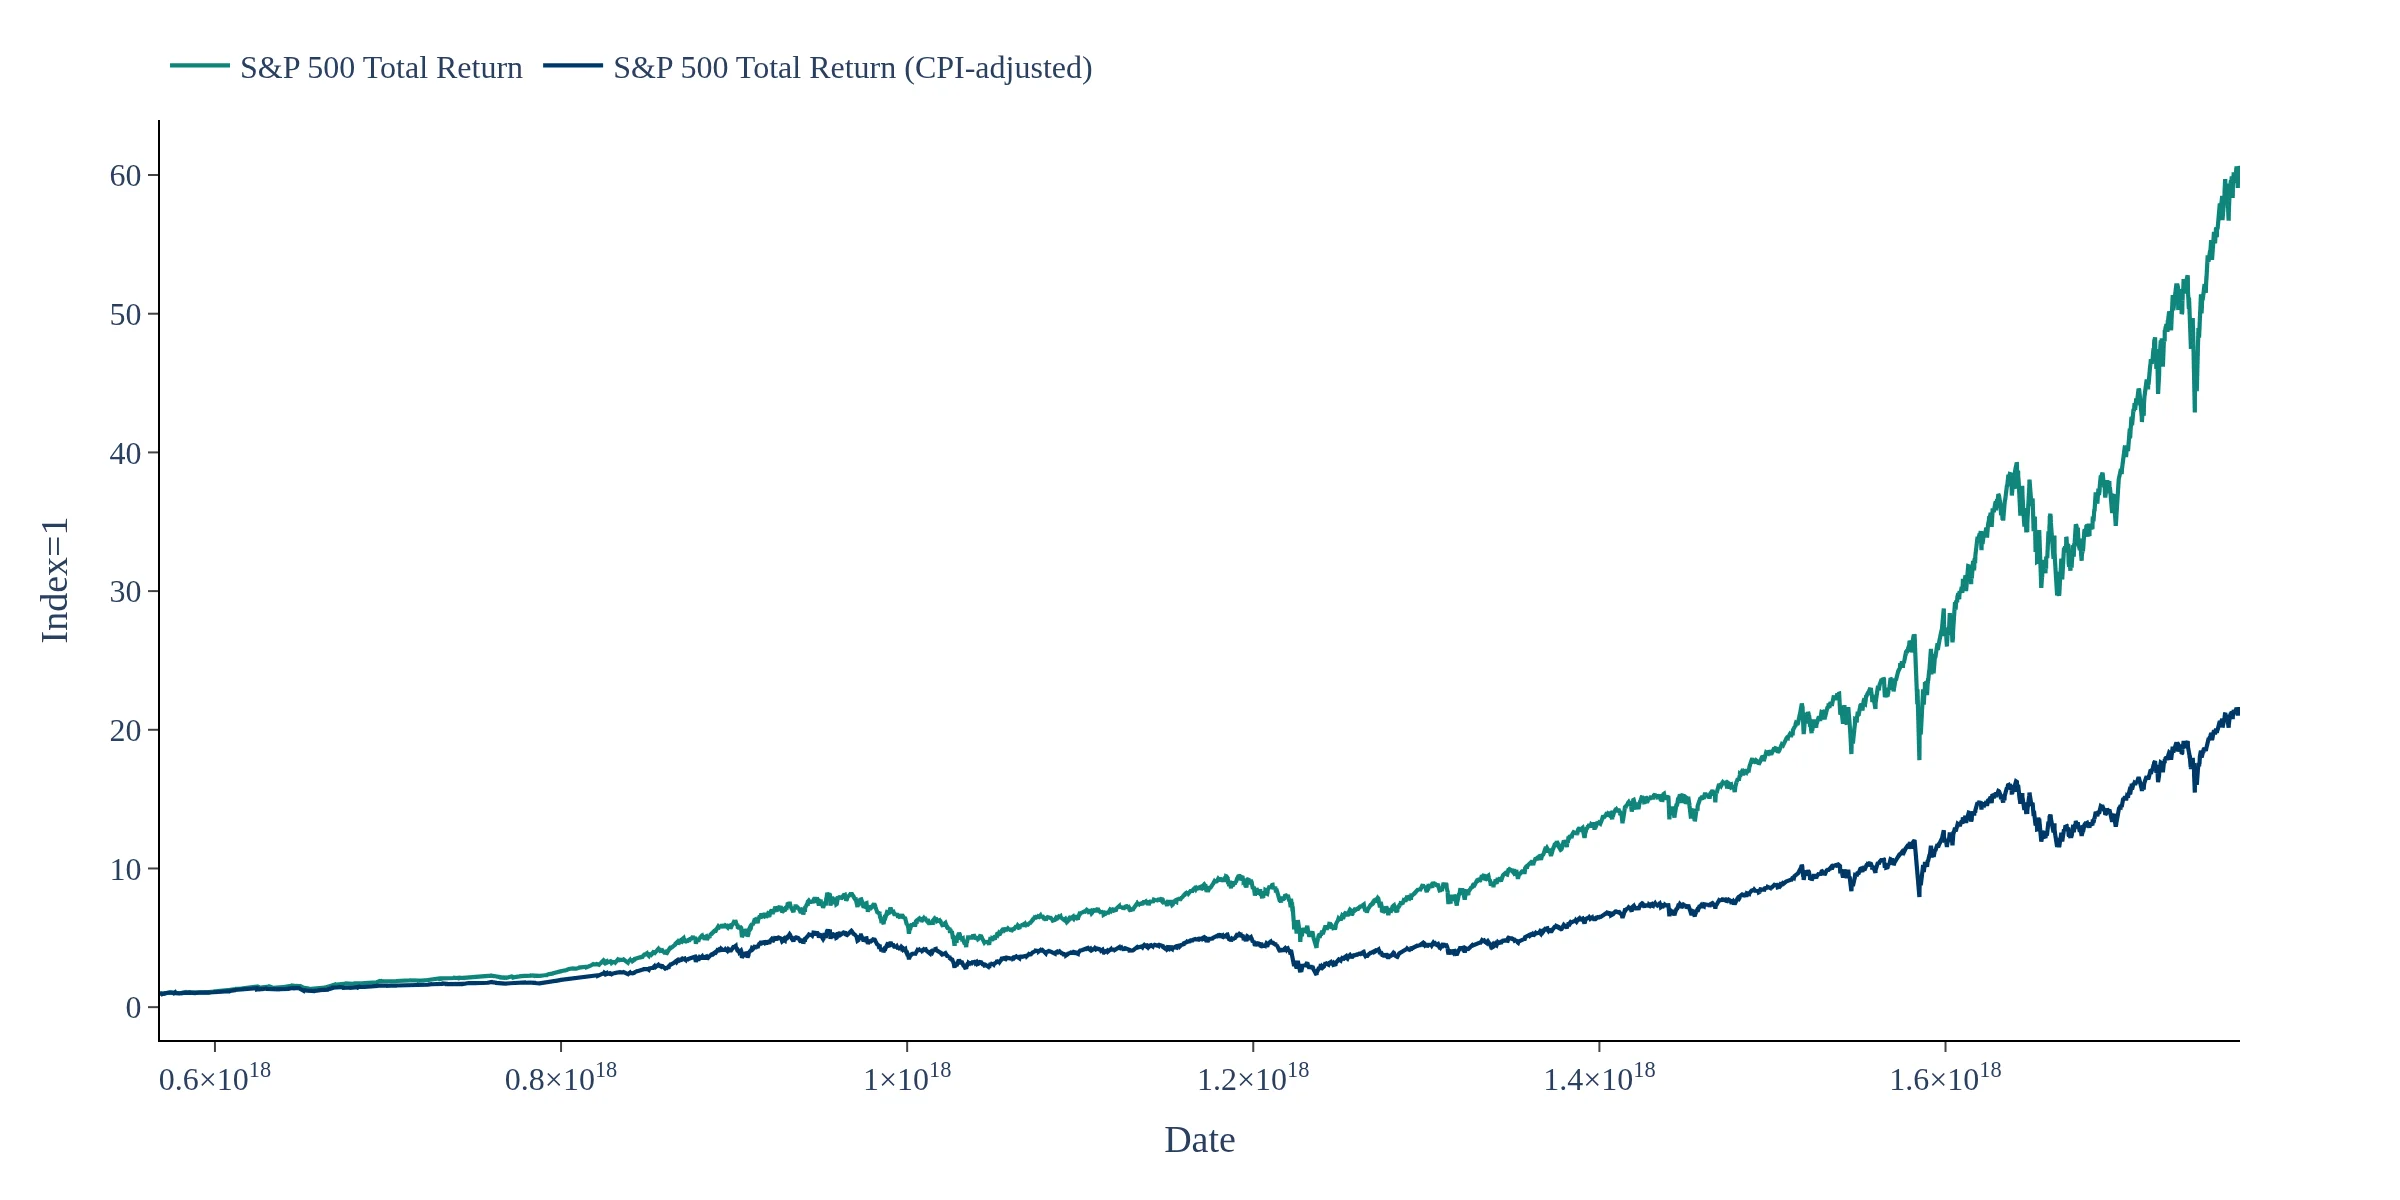
US S&P 500 Total Return, CPI-adjusted. Get real insight into how purchasing power is evolving in US Equities