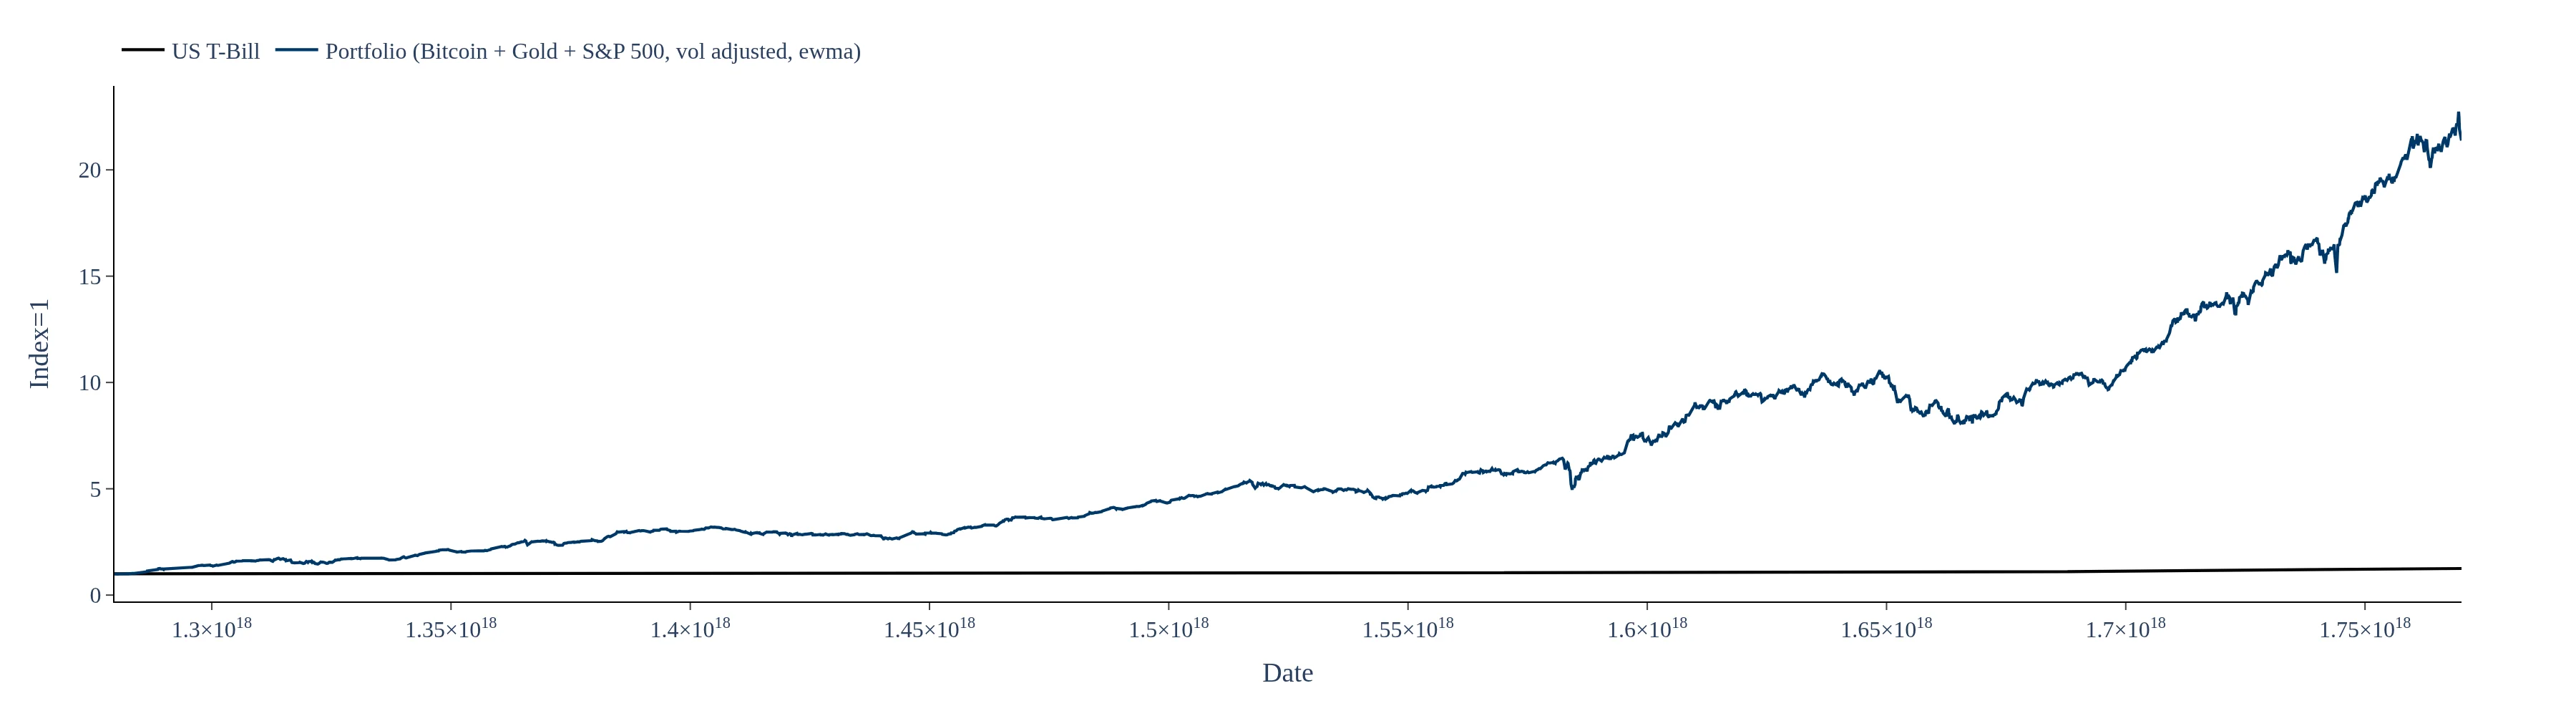
Dashboard consolidating backtest and analysis on a vol-weighted portfolio of S&P 500 and Gold. No dividends included.
The S&P 500 + Gold Volatility Adjusted Portfolio employs a systematic strategy that adjusts asset weights based on a 30-day volatility estimate. By reducing exposure to the asset with higher recent volatility and increasing allocation to the lower-volatility asset, this approach aims to create a more stable risk profile for investors.
The dashboard provides performance metrics including normalized returns displayed as an index in USD, along with monthly and annual returns. These metrics allow investors to compare the volatility-adjusted portfolio's performance against standalone S&P 500 and Gold series, enhancing decision-making.
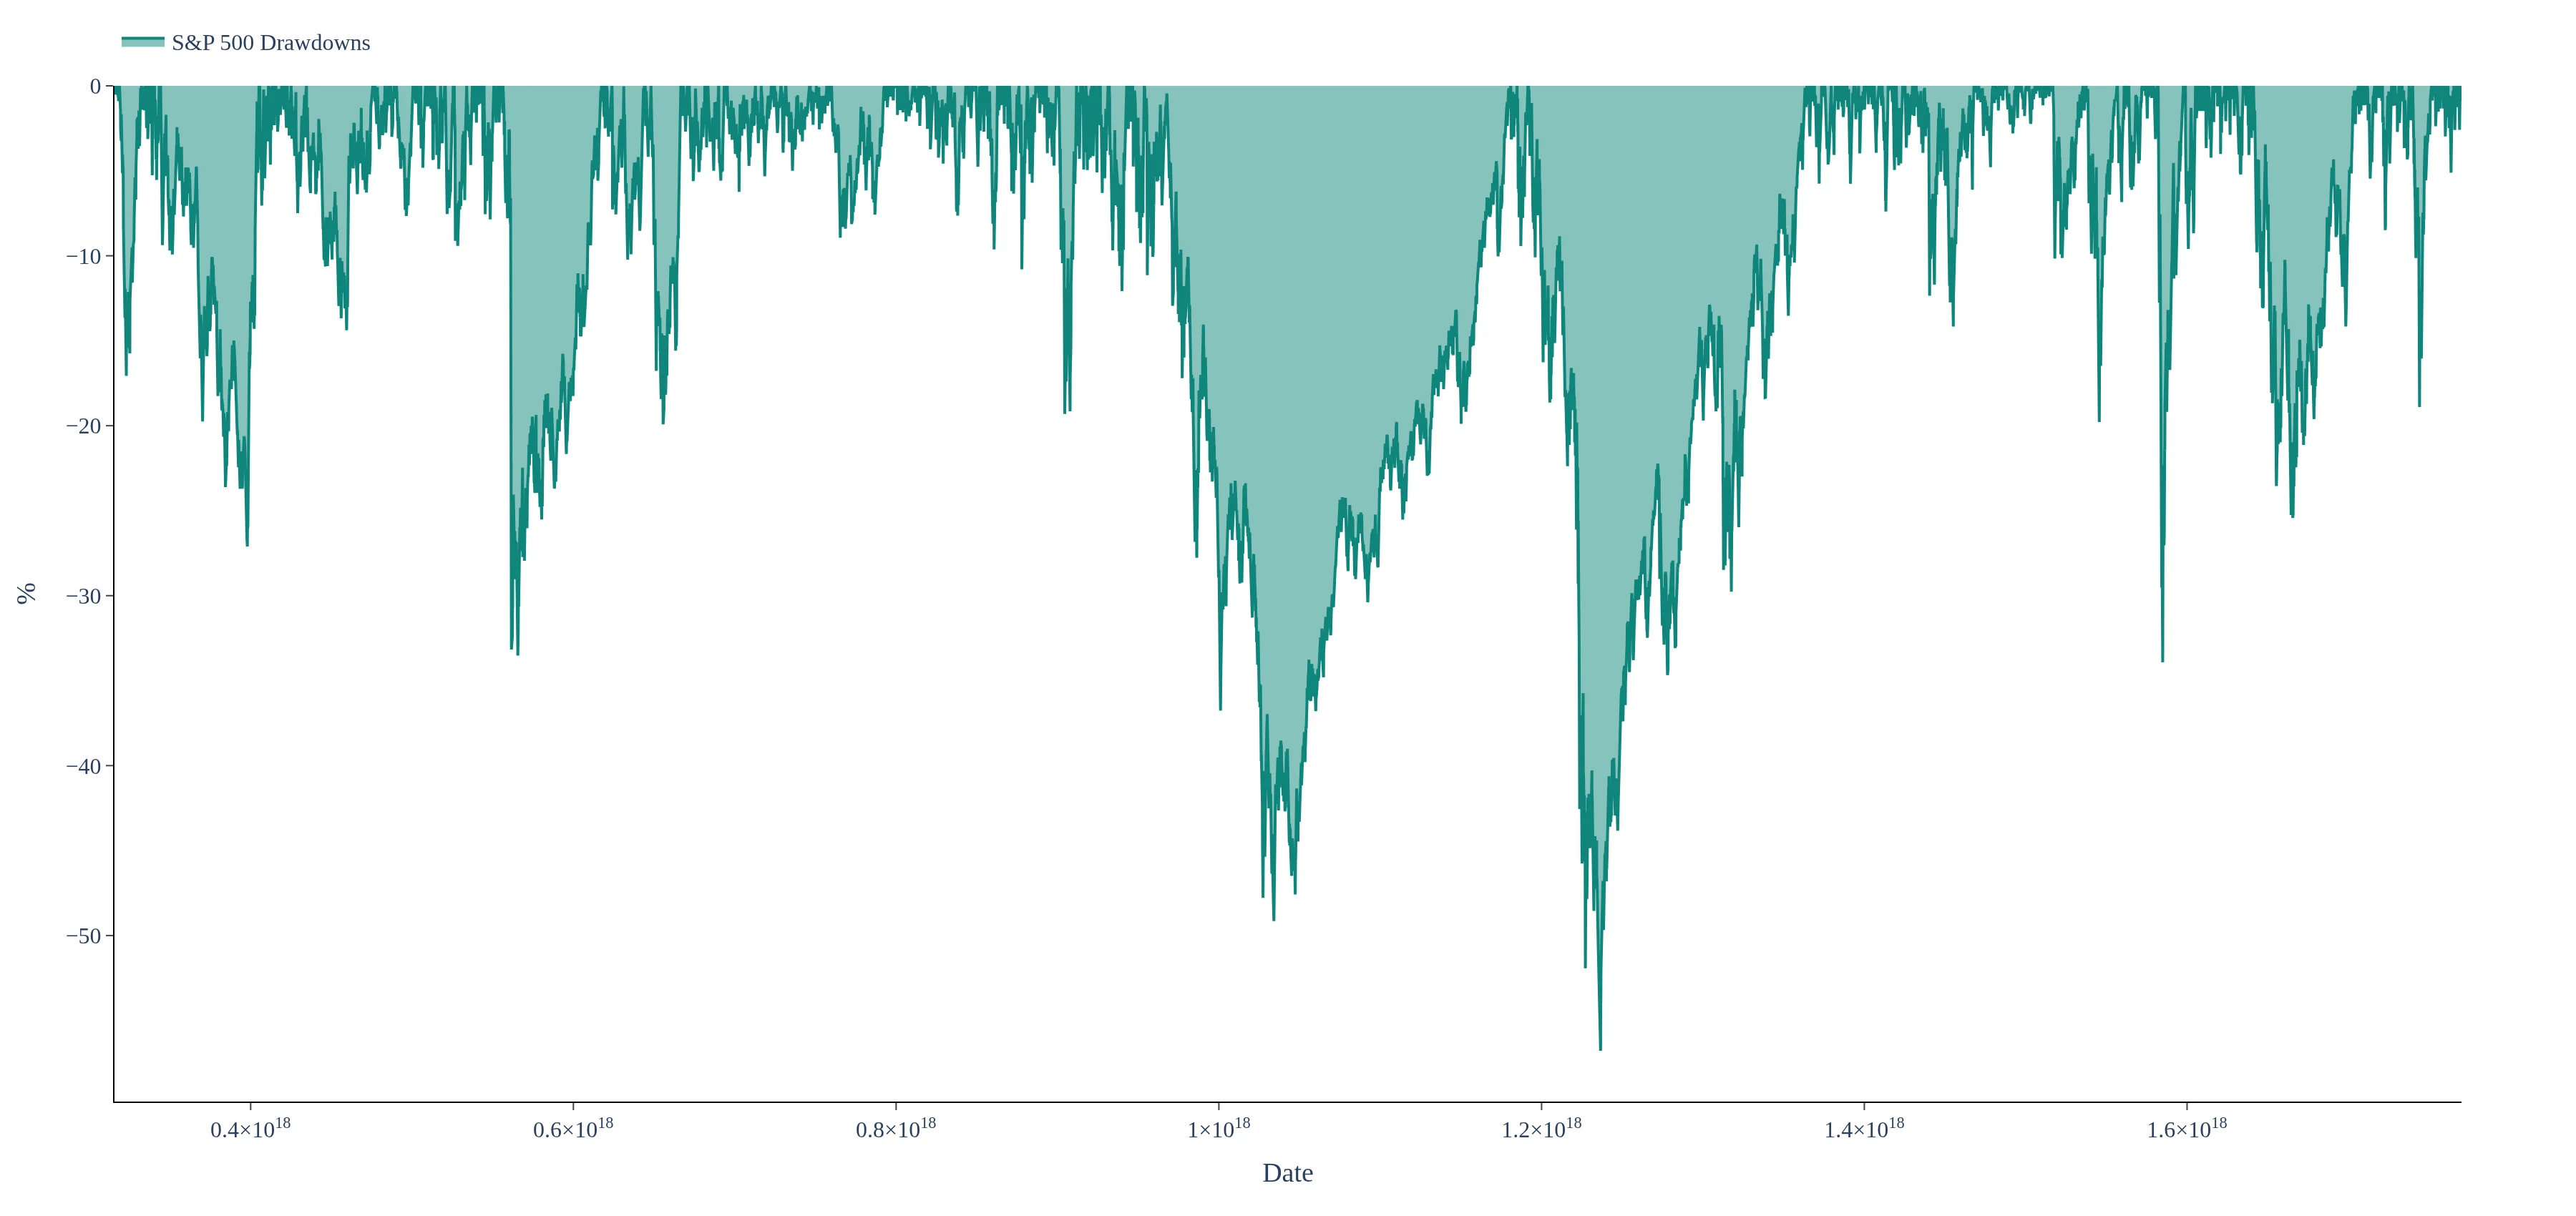
Yes, the dashboard features time-window controls that enable users to evaluate the portfolio's performance across various market cycles and volatility regimes. This functionality helps investors understand how allocation shifts during different market conditions, providing insights into drawdowns and recovery periods.
This dashboard backtests a volatility-adjusted portfolio combining the S&P 500 and Gold, with weights scaled using a 30-day volatility estimate. The strategy targets a more stable risk profile by reducing exposure to the asset with higher recent volatility and allocating relatively more to the lower-vol asset. Returns are shown as a normalized index in USD, alongside the standalone S&P 500 and Gold series for comparison (no dividends included for the equity leg). Use the time-window controls to evaluate performance across cycles, drawdowns, and how the allocation shifts in different volatility regimes.