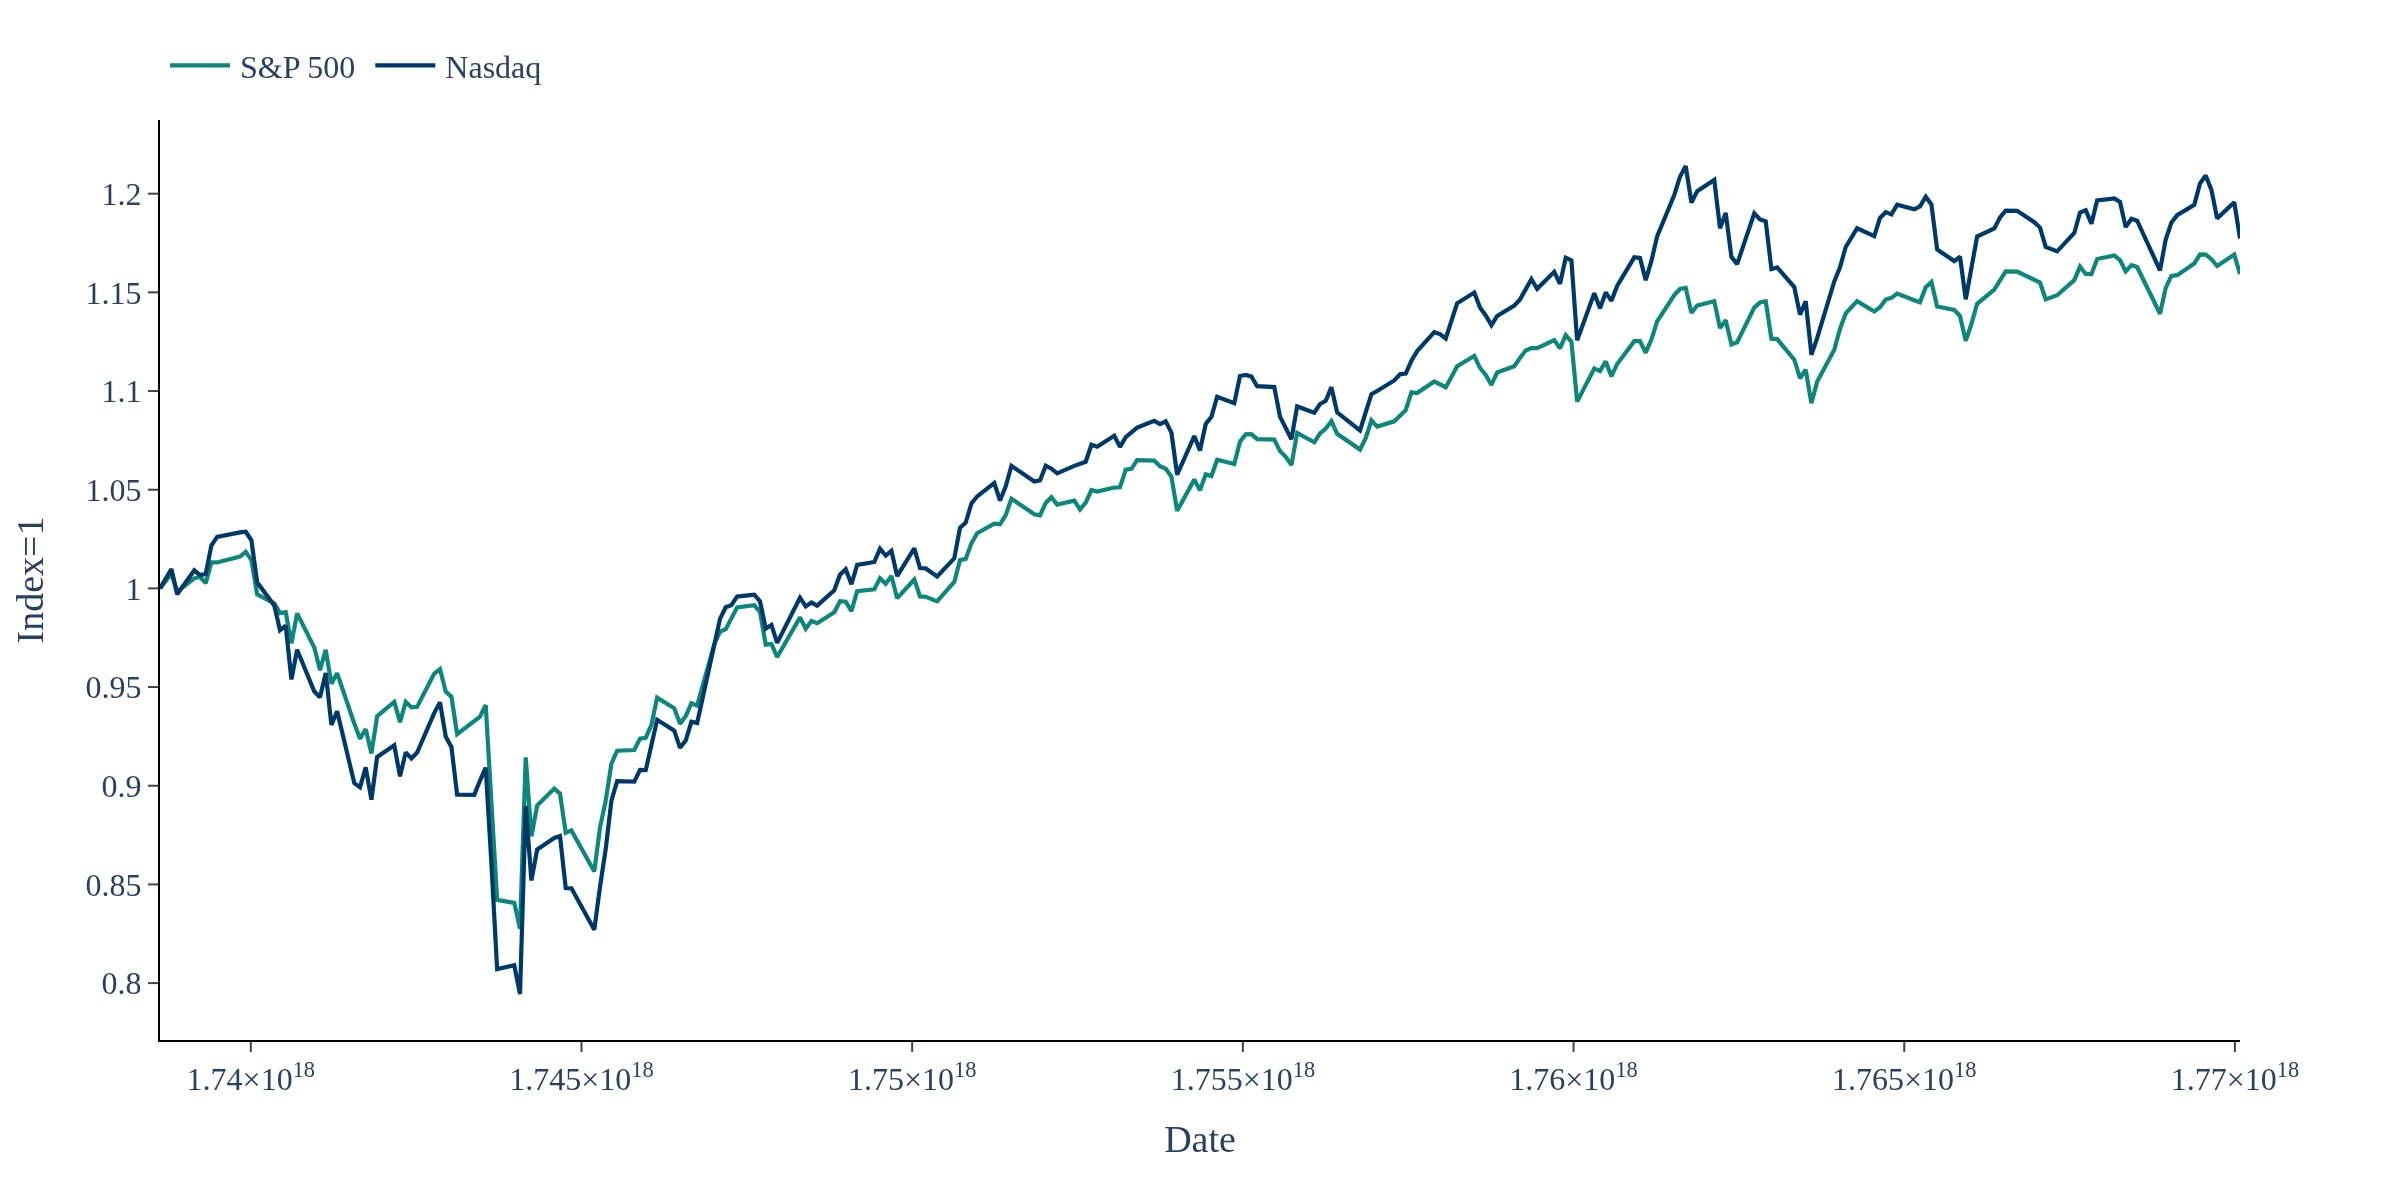
The seasonality path of the S&P 500 is the average year-to-date return at every date of the year, considering all previous years performance (All years since 1980).
The S&P 500 seasonality path provides insights into historical average year-to-date returns, allowing traders to identify recurring seasonal trends and potential drawdown periods. By analyzing how different years typically perform during specific times of the year, you can better time your entry and exit points in the market.
The historical mean and median paths in the S&P 500 seasonality dashboard serve as benchmarks for evaluating current year performance against historical trends. These reference lines help investors understand typical market behavior and identify periods when gains are likely to concentrate, enhancing decision-making.
The S&P 500 seasonality data is updated on trading days, providing investors with timely insights into market trends. This frequent updating is crucial for making informed trading decisions based on the latest performance metrics and seasonal tendencies.
This screen shows the S&P 500 seasonality path by normalizing each year’s price series to 1.0 at the start of the year and plotting the cumulative performance through the calendar. Daily prices are aligned by month/day so you can compare how different years typically evolve across the same seasonal window. The chart highlights the current year versus historical history and includes summary reference lines such as the historical mean and median path. This view helps identify recurring seasonal tendencies, common drawdown periods and when gains usually concentrate during the year. Data is updated on trading days and presented for fast seasonality and risk context.