Monitor detailed financial statement metrics for the S&P 500 stocks
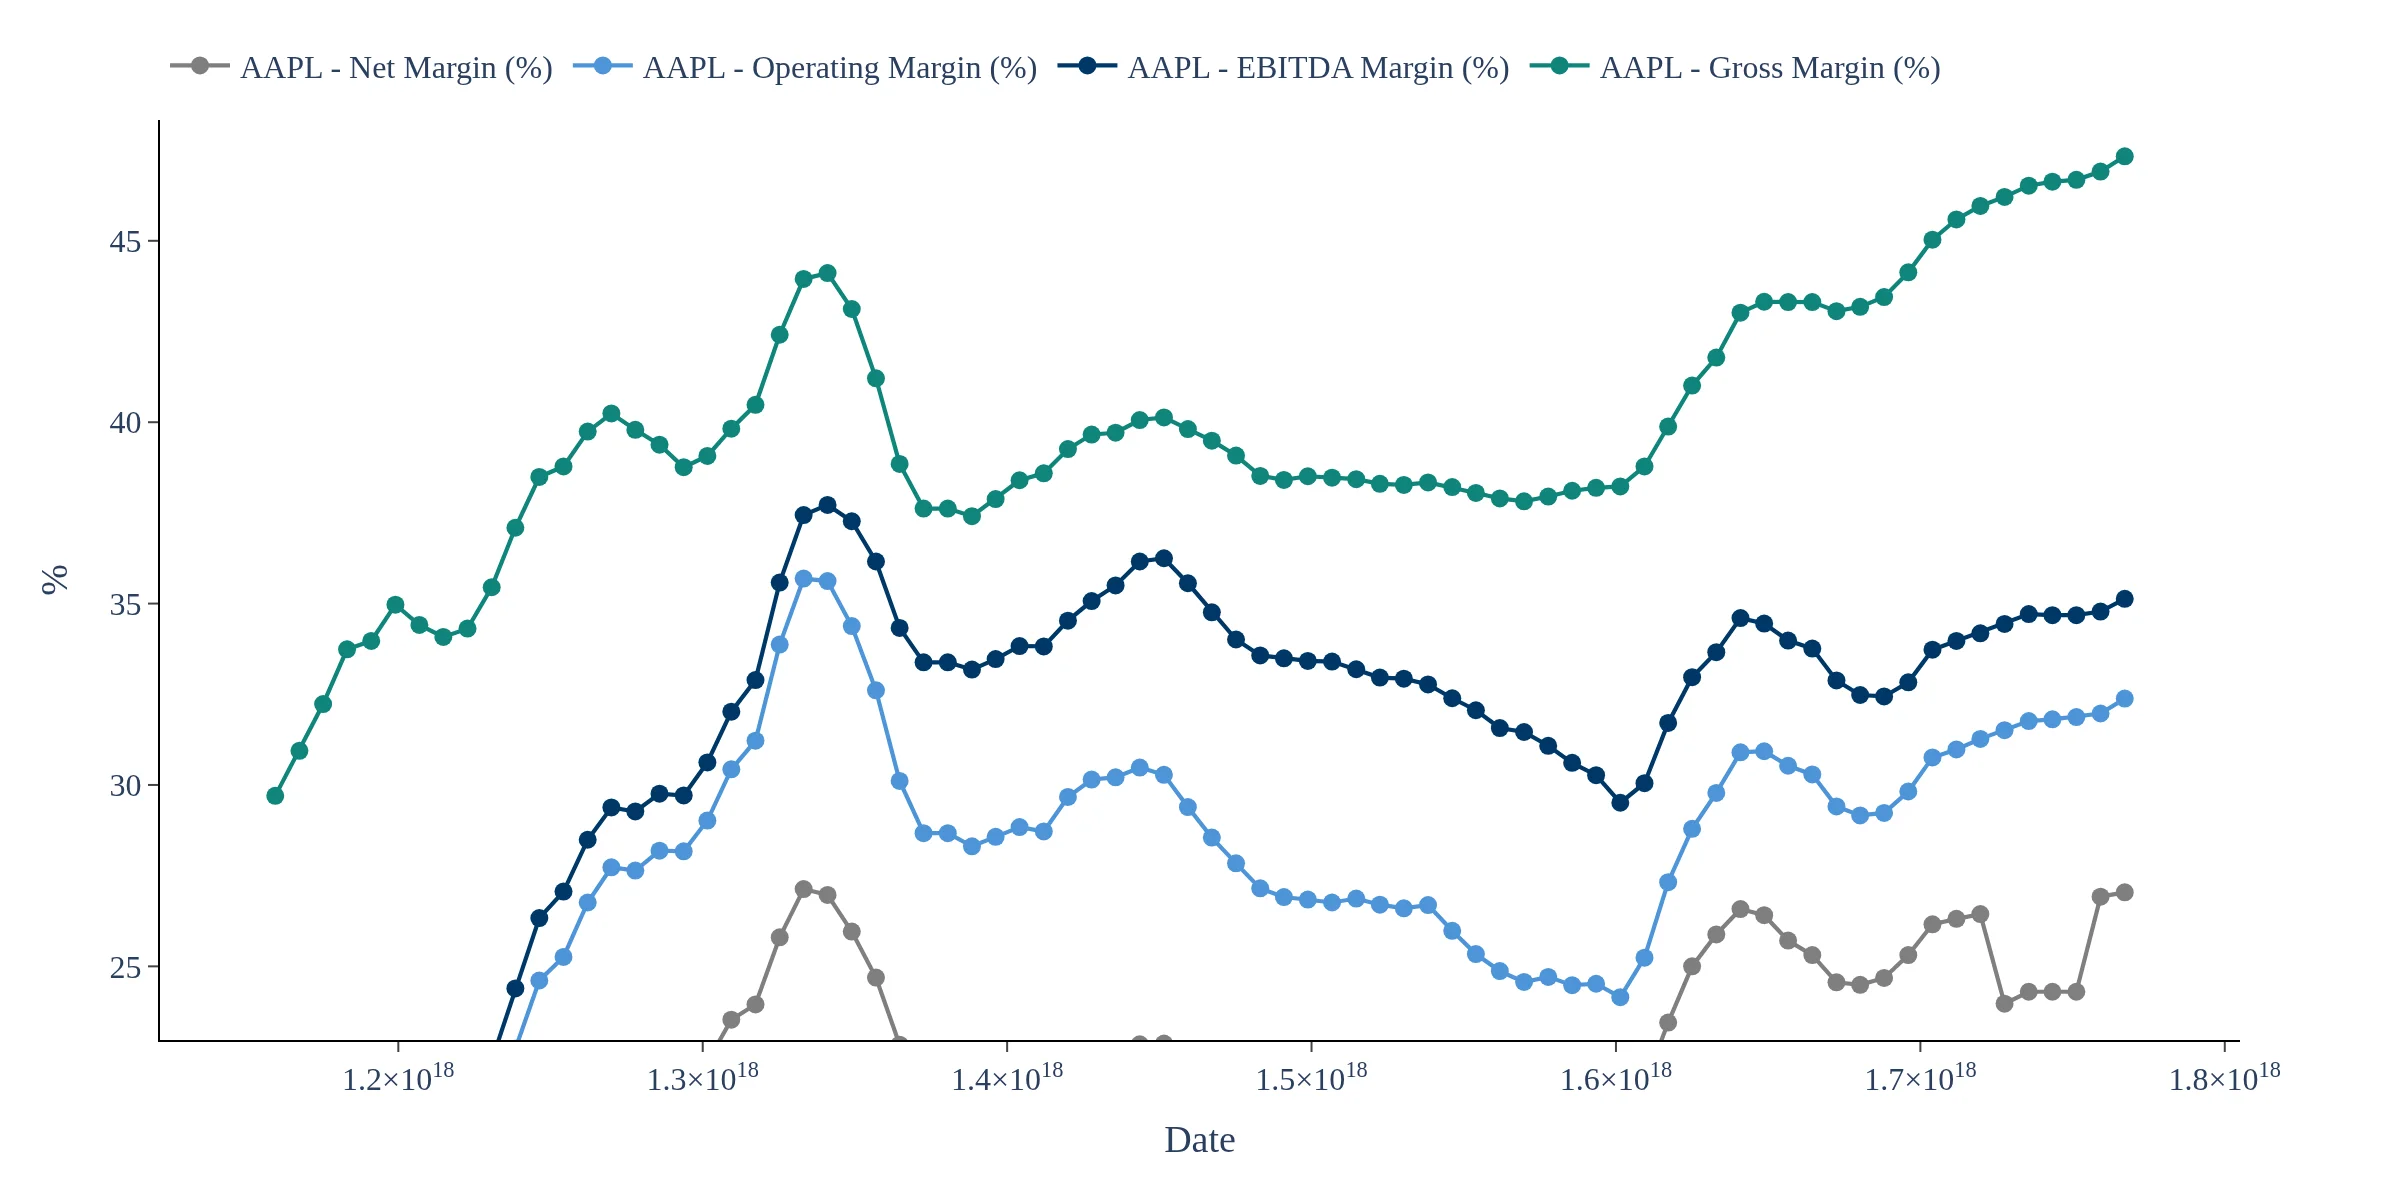
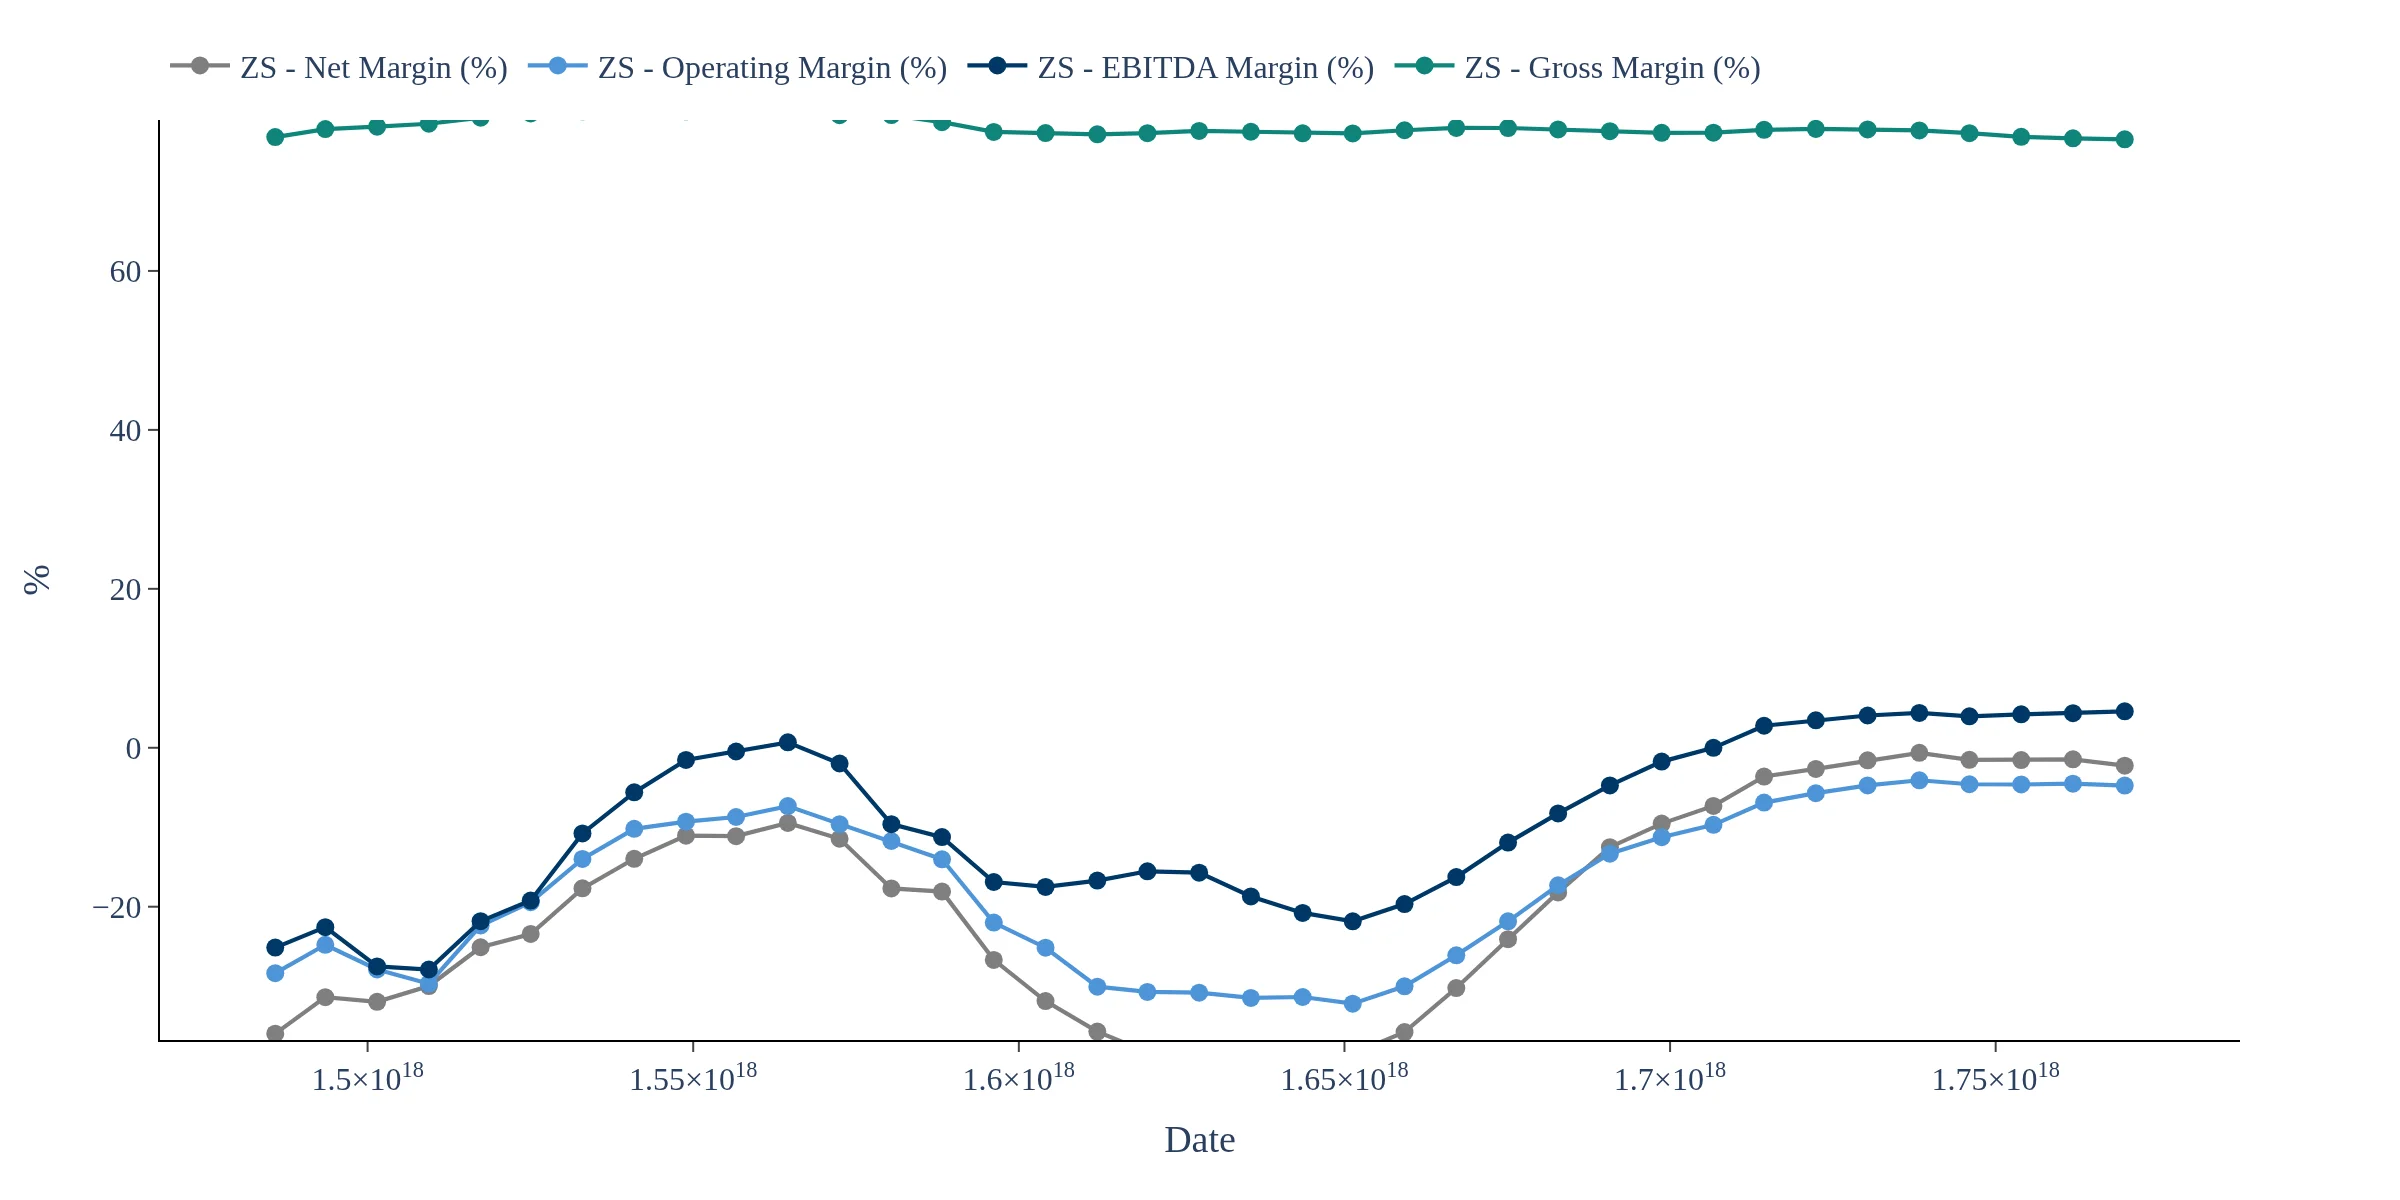
The S&P 500 Stocks Financials Screener provides key profitability ratios, including gross margin, EBITDA margin, and net margin, allowing investors to compare business quality across sectors. By monitoring these metrics alongside revenue and net income, you can identify trends in profitability and assess which companies are leading or lagging in their financial performance.
This dashboard includes essential financial metrics such as Revenue, EBITDA, Net Income, and Operating Income, tracked on a quarterly basis as well as on a trailing 12-month basis. This comprehensive approach helps reduce seasonality effects and allows for a more accurate comparison of financial performance among S&P 500 companies.
Yes, the S&P 500 Stocks Financials Screener allows users to download the underlying financial data, enabling deeper analysis of S&P 500 fundamentals. This feature is particularly useful for traders and analysts looking to conduct detailed evaluations of growth trends and margin changes across different sectors.
This dashboard is a financials screener for all S&P 500 companies, combining income statement metrics in a standardized, comparable format. It tracks Revenue, EBITDA, Net Income and other measures on a quarterly basis and also as trailing 12-month (last 4 quarters) totals to reduce seasonality. The screener includes key profitability ratios such as gross margin, EBITDA margin and net margin to compare business quality across sectors. Data is organized to quickly identify growth trends, margin expansion or deterioration, and relative profitability leaders and laggards. Use it to screen S&P 500 fundamentals efficiently and download the underlying financial data for deeper analysis.
Track key financial statement measures for the magnificent seven companies
Track quarterly financials for all the stocks in the Nasdaq 100 - Interactive charts with downloadable data
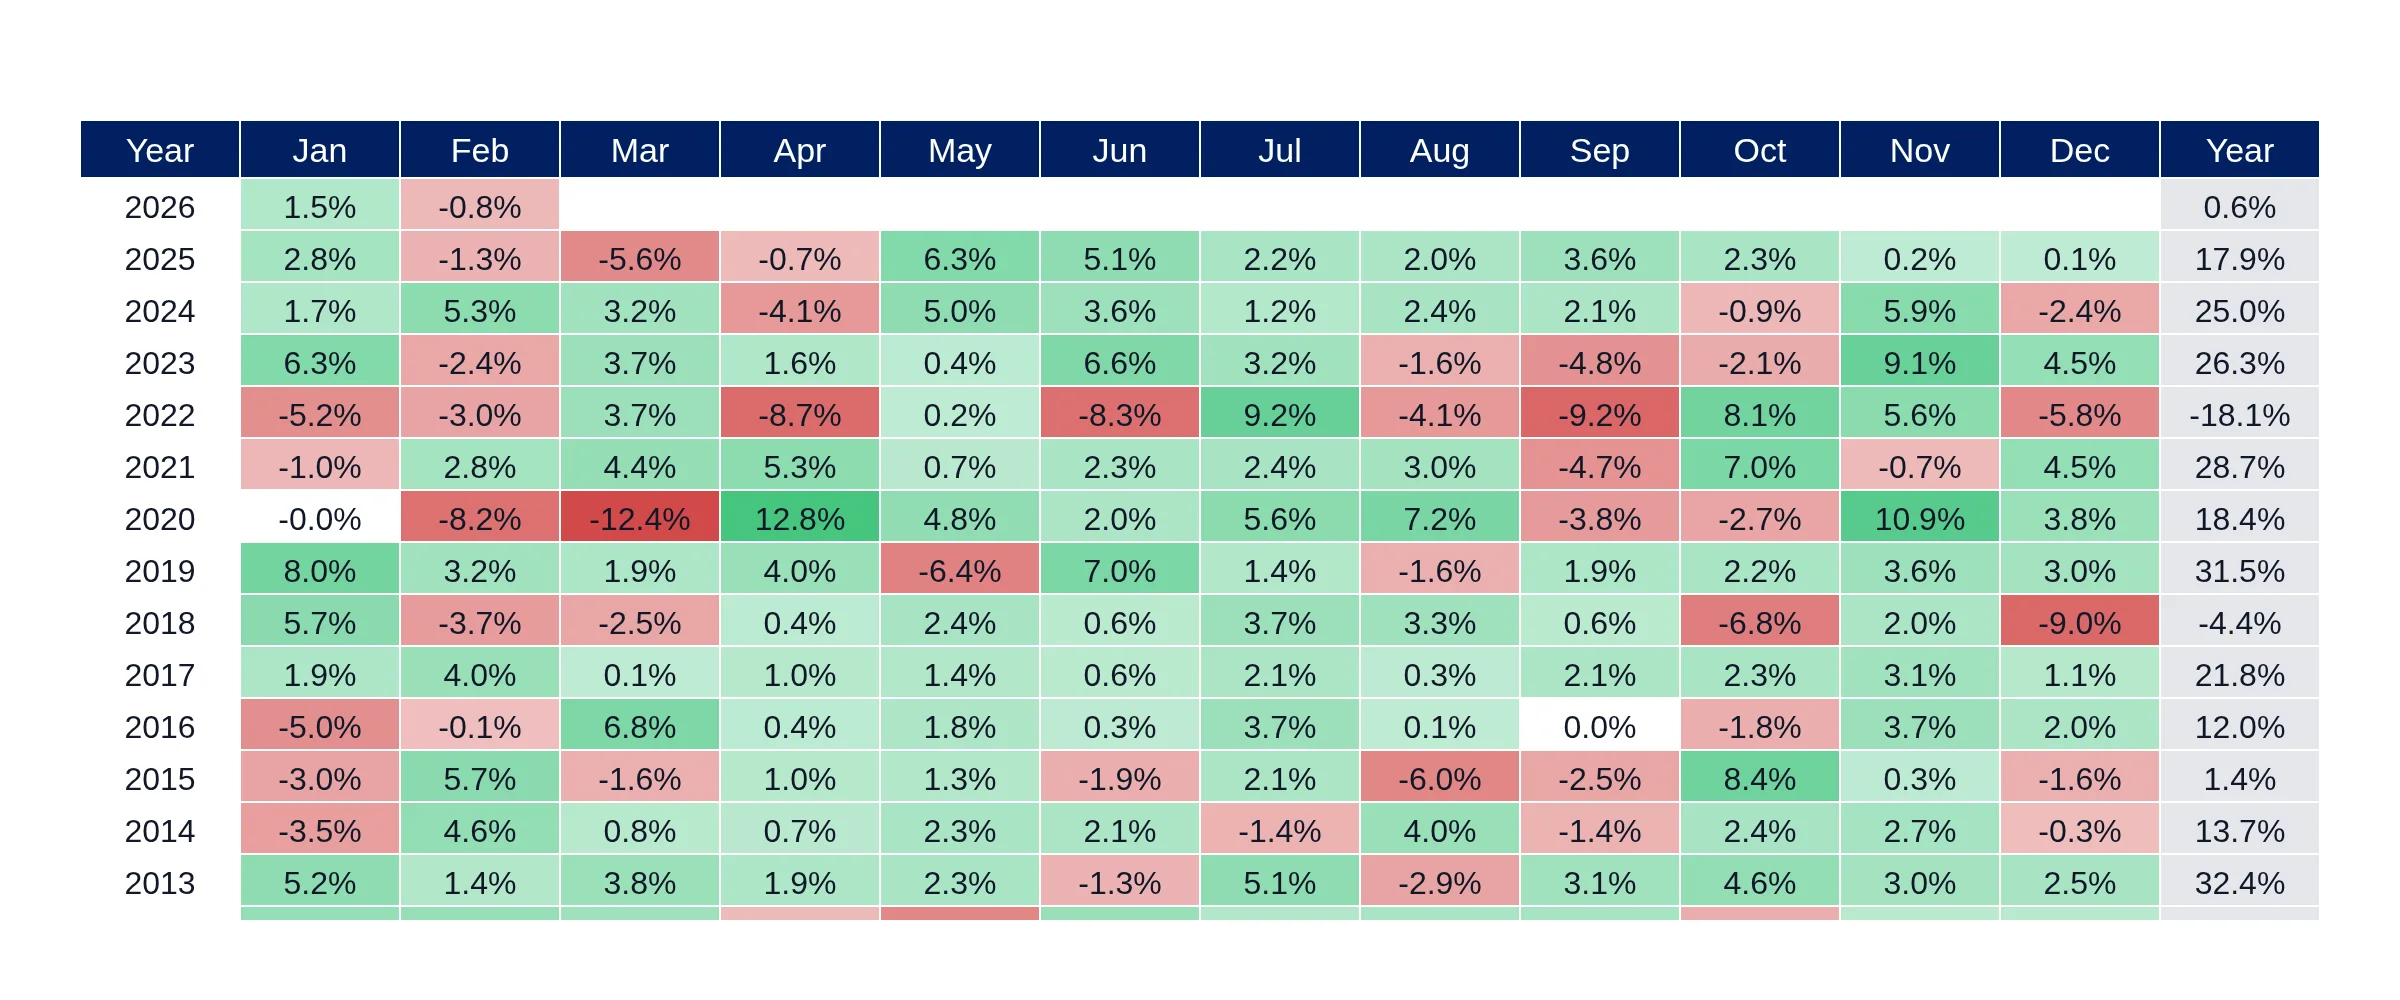
Track S&P 500 returns like no other tool does