Monitor detailed financial statement metrics for the magnificent 7 stocks: AAPL, AMZN, GOOG, META, TSLA, NVDA, MSFT
You can analyze the revenue trends of the Magnificent 7 stocks by using the 'Quarterly Revenue' and 'Trailing 4-Quarter Revenue' charts on the dashboard. These charts provide comprehensive insights into each company's revenue growth over time, allowing for easy comparison among AAPL, AMZN, GOOG, META, MSFT, NVDA, and TSLA.
The Magnificent 7 financials screener includes key financial metrics such as revenue, EBITDA, operating income, net income, and profitability margins. By examining these metrics, investors can gain a deeper understanding of the financial health and performance of each stock within the group.
To compare EBITDA across the Magnificent 7 stocks, utilize the 'Quarterly EBITDA' and 'Trailing 4-Quarter EBITDA' charts available on the dashboard. These visualizations allow investors to track and benchmark EBITDA performance, helping to identify growth trends and operational efficiency among the leading tech companies.
This dashboard is a Magnificent 7 financials screener that lets you filter tickers (AAPL, AMZN, GOOG, META, MSFT, NVDA, TSLA) and explore company-by-company fundamentals in one place. We compile quarterly and trailing 4-quarter (TTM) series for key financial statement metrics such as revenue, EBITDA, operating income, net income, and profitability margins. The charts help compare growth trends, earnings cycles, and margin dynamics across Big Tech leaders over time. Use the ticker search to quickly switch companies and benchmark fundamentals within the Magnificent 7.
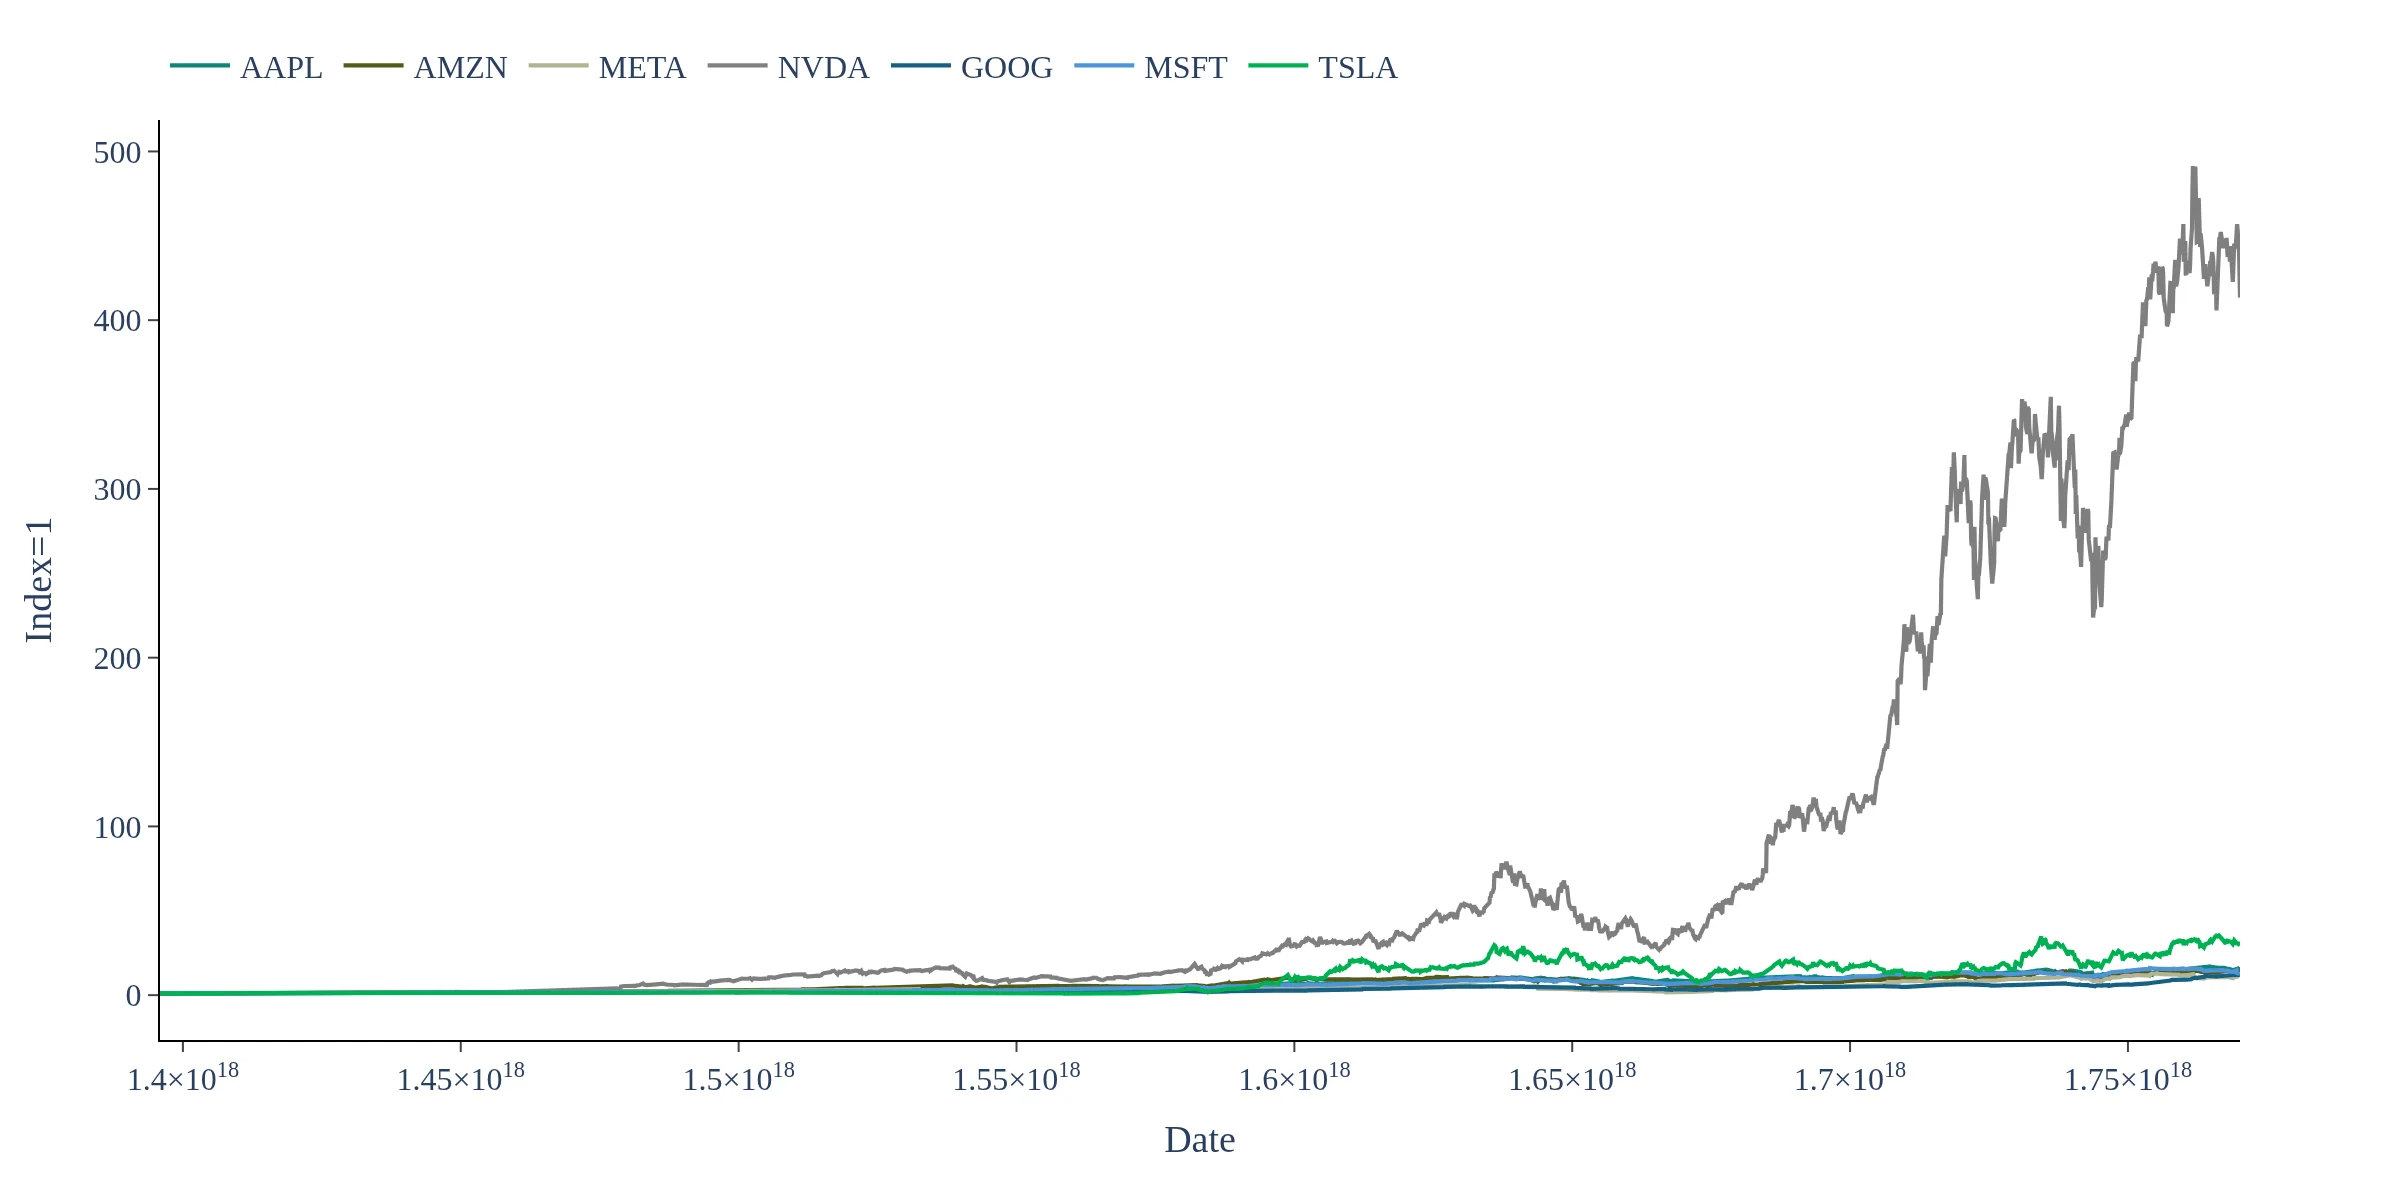
Track how the Magnificent 7 stocks are performing inside an equal weighted portfolio, daily rebalanced
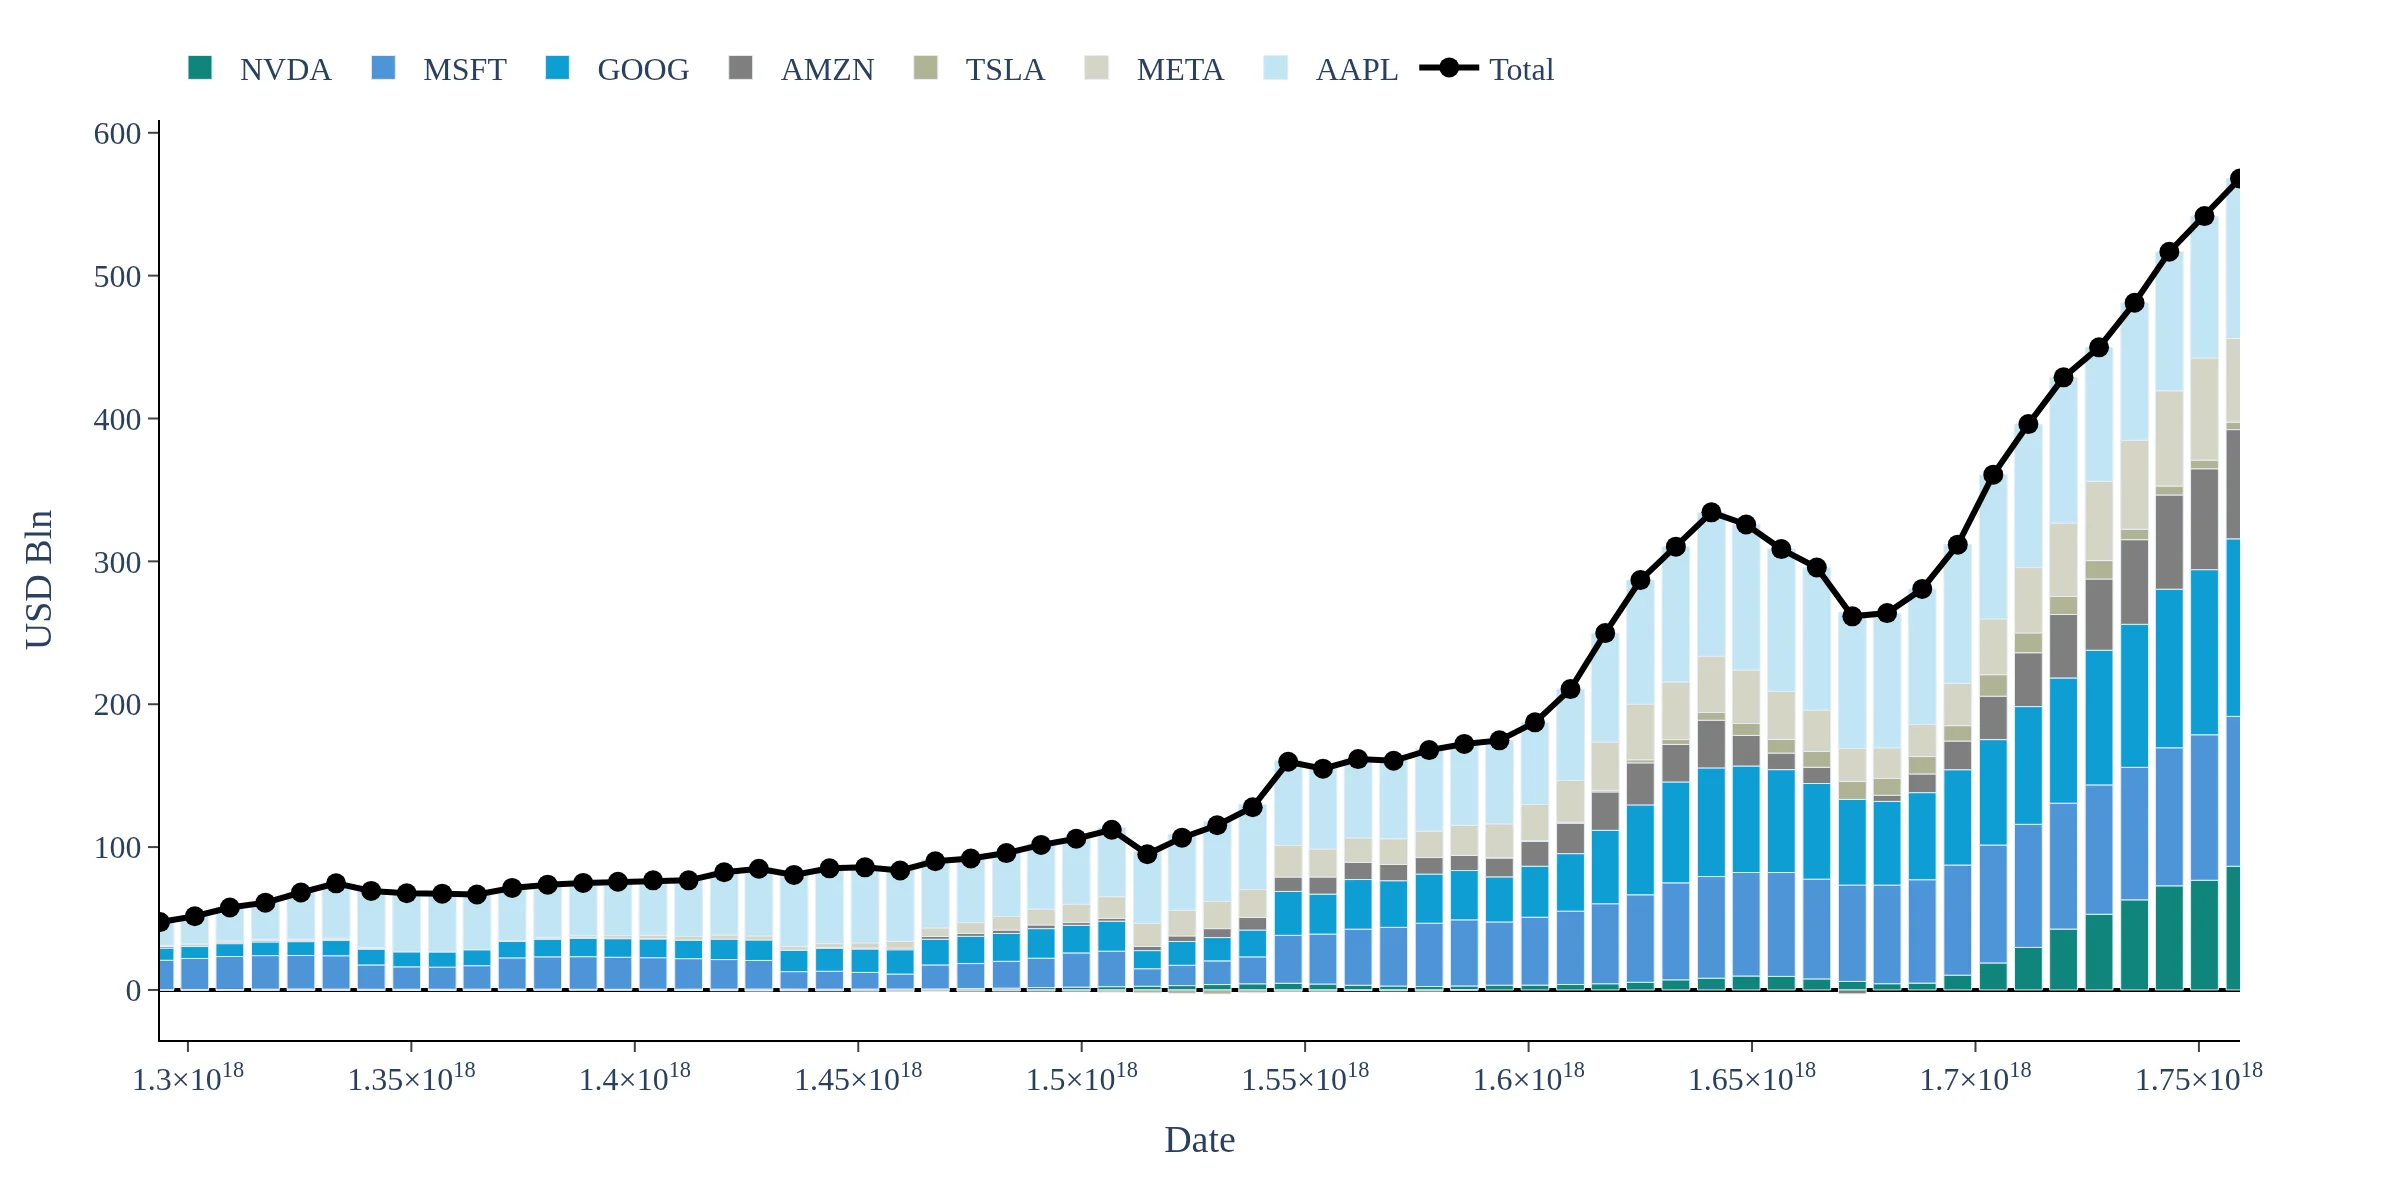
Track the main aggregate financial statement measures for the magnificent seven companies
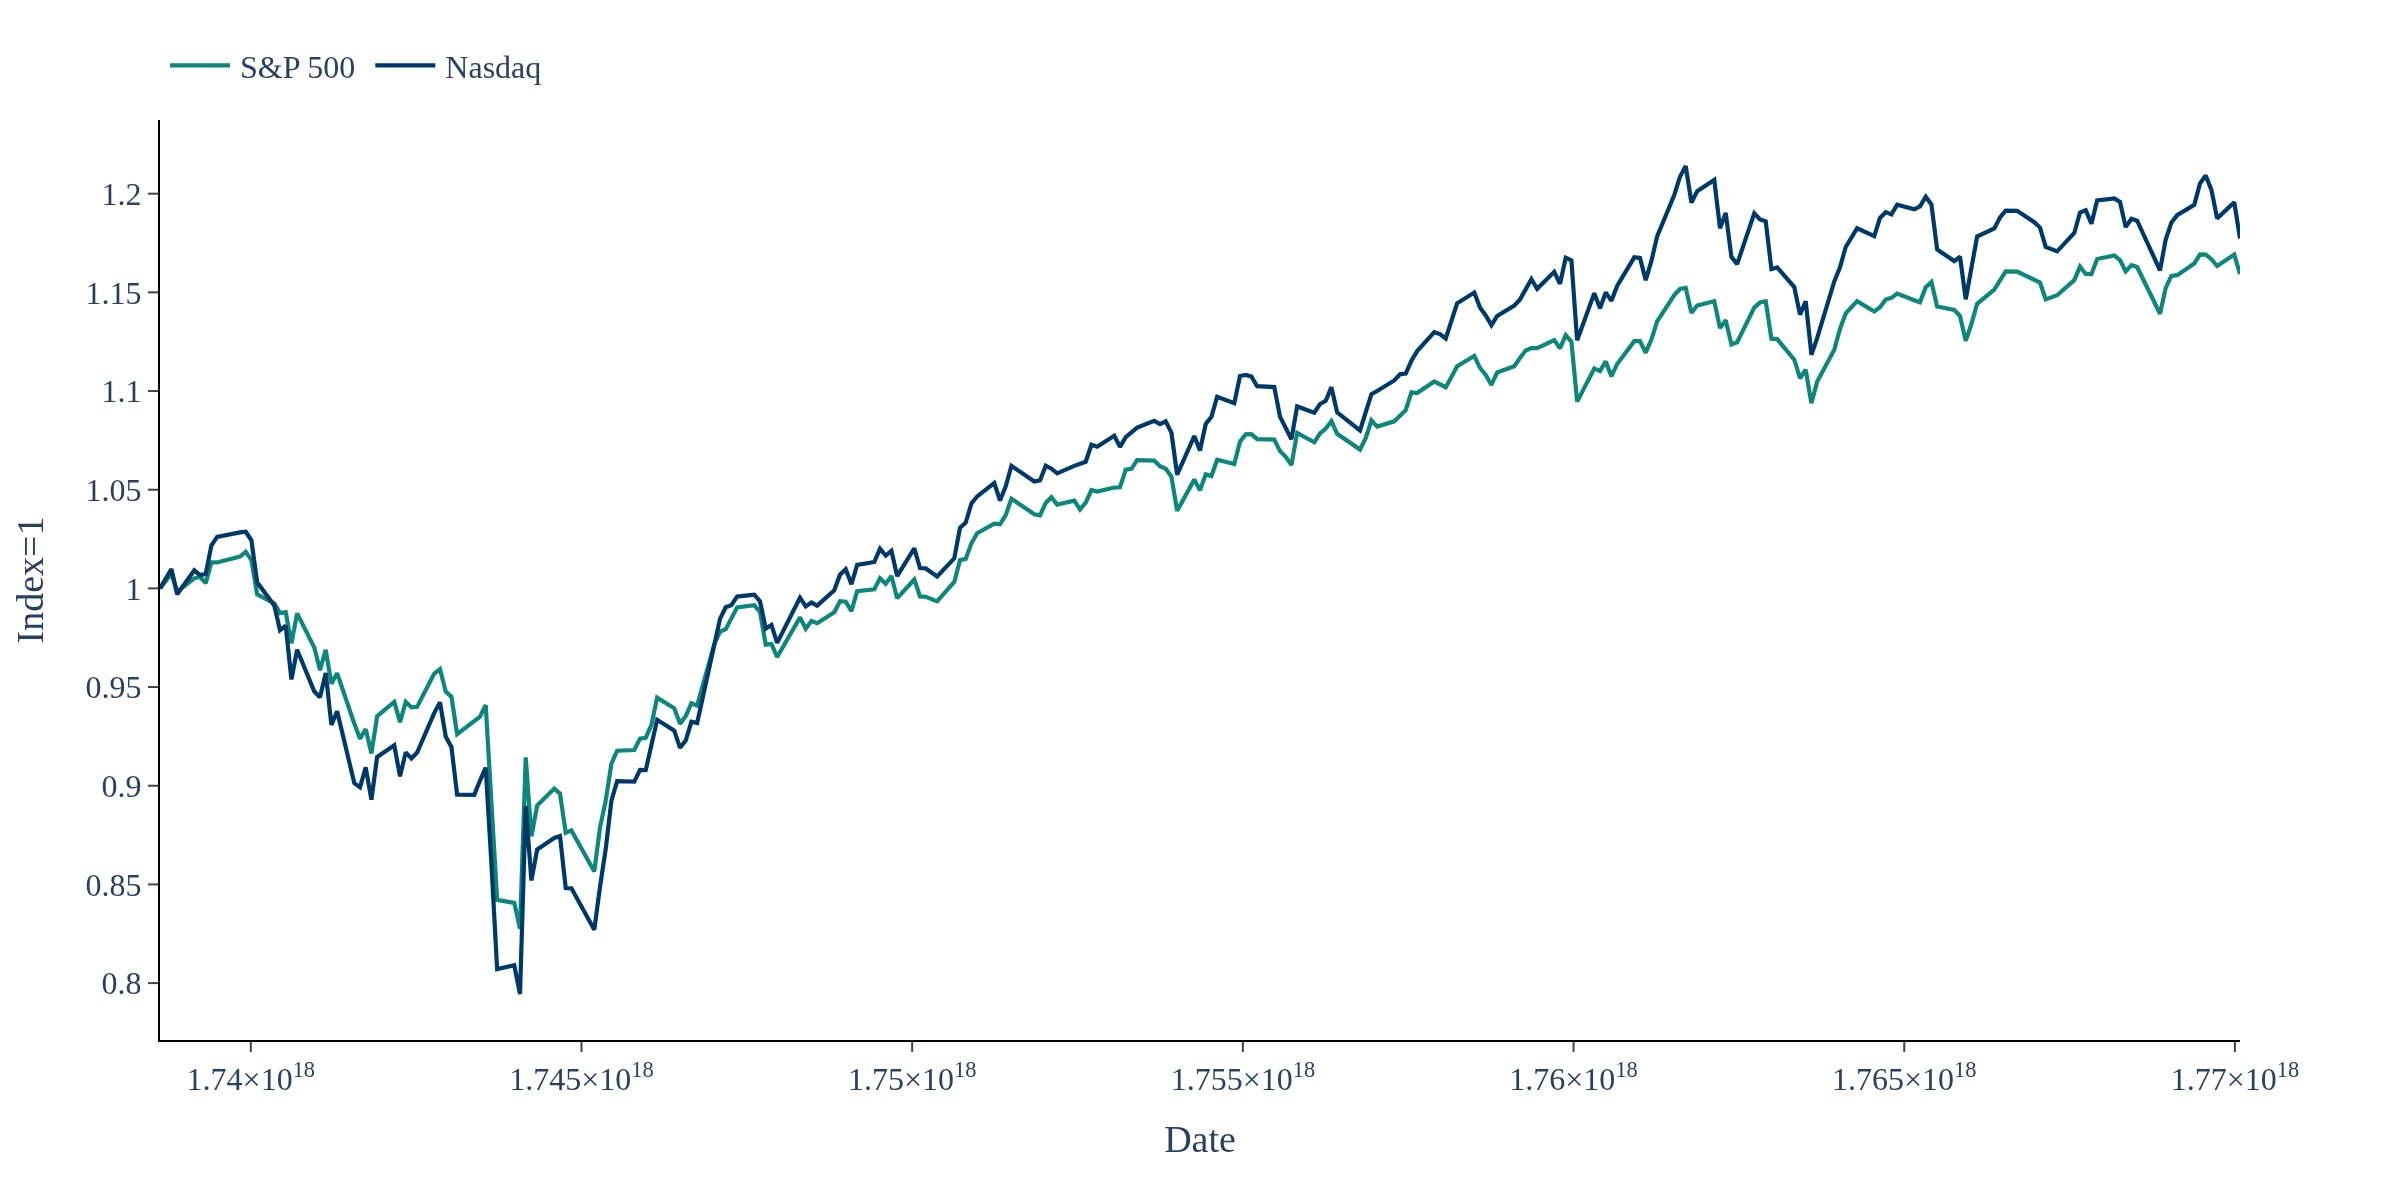
Track how are US Equities are behaving