Monitor detailed performance and risk metrics for all the companies inside the S&P 500.
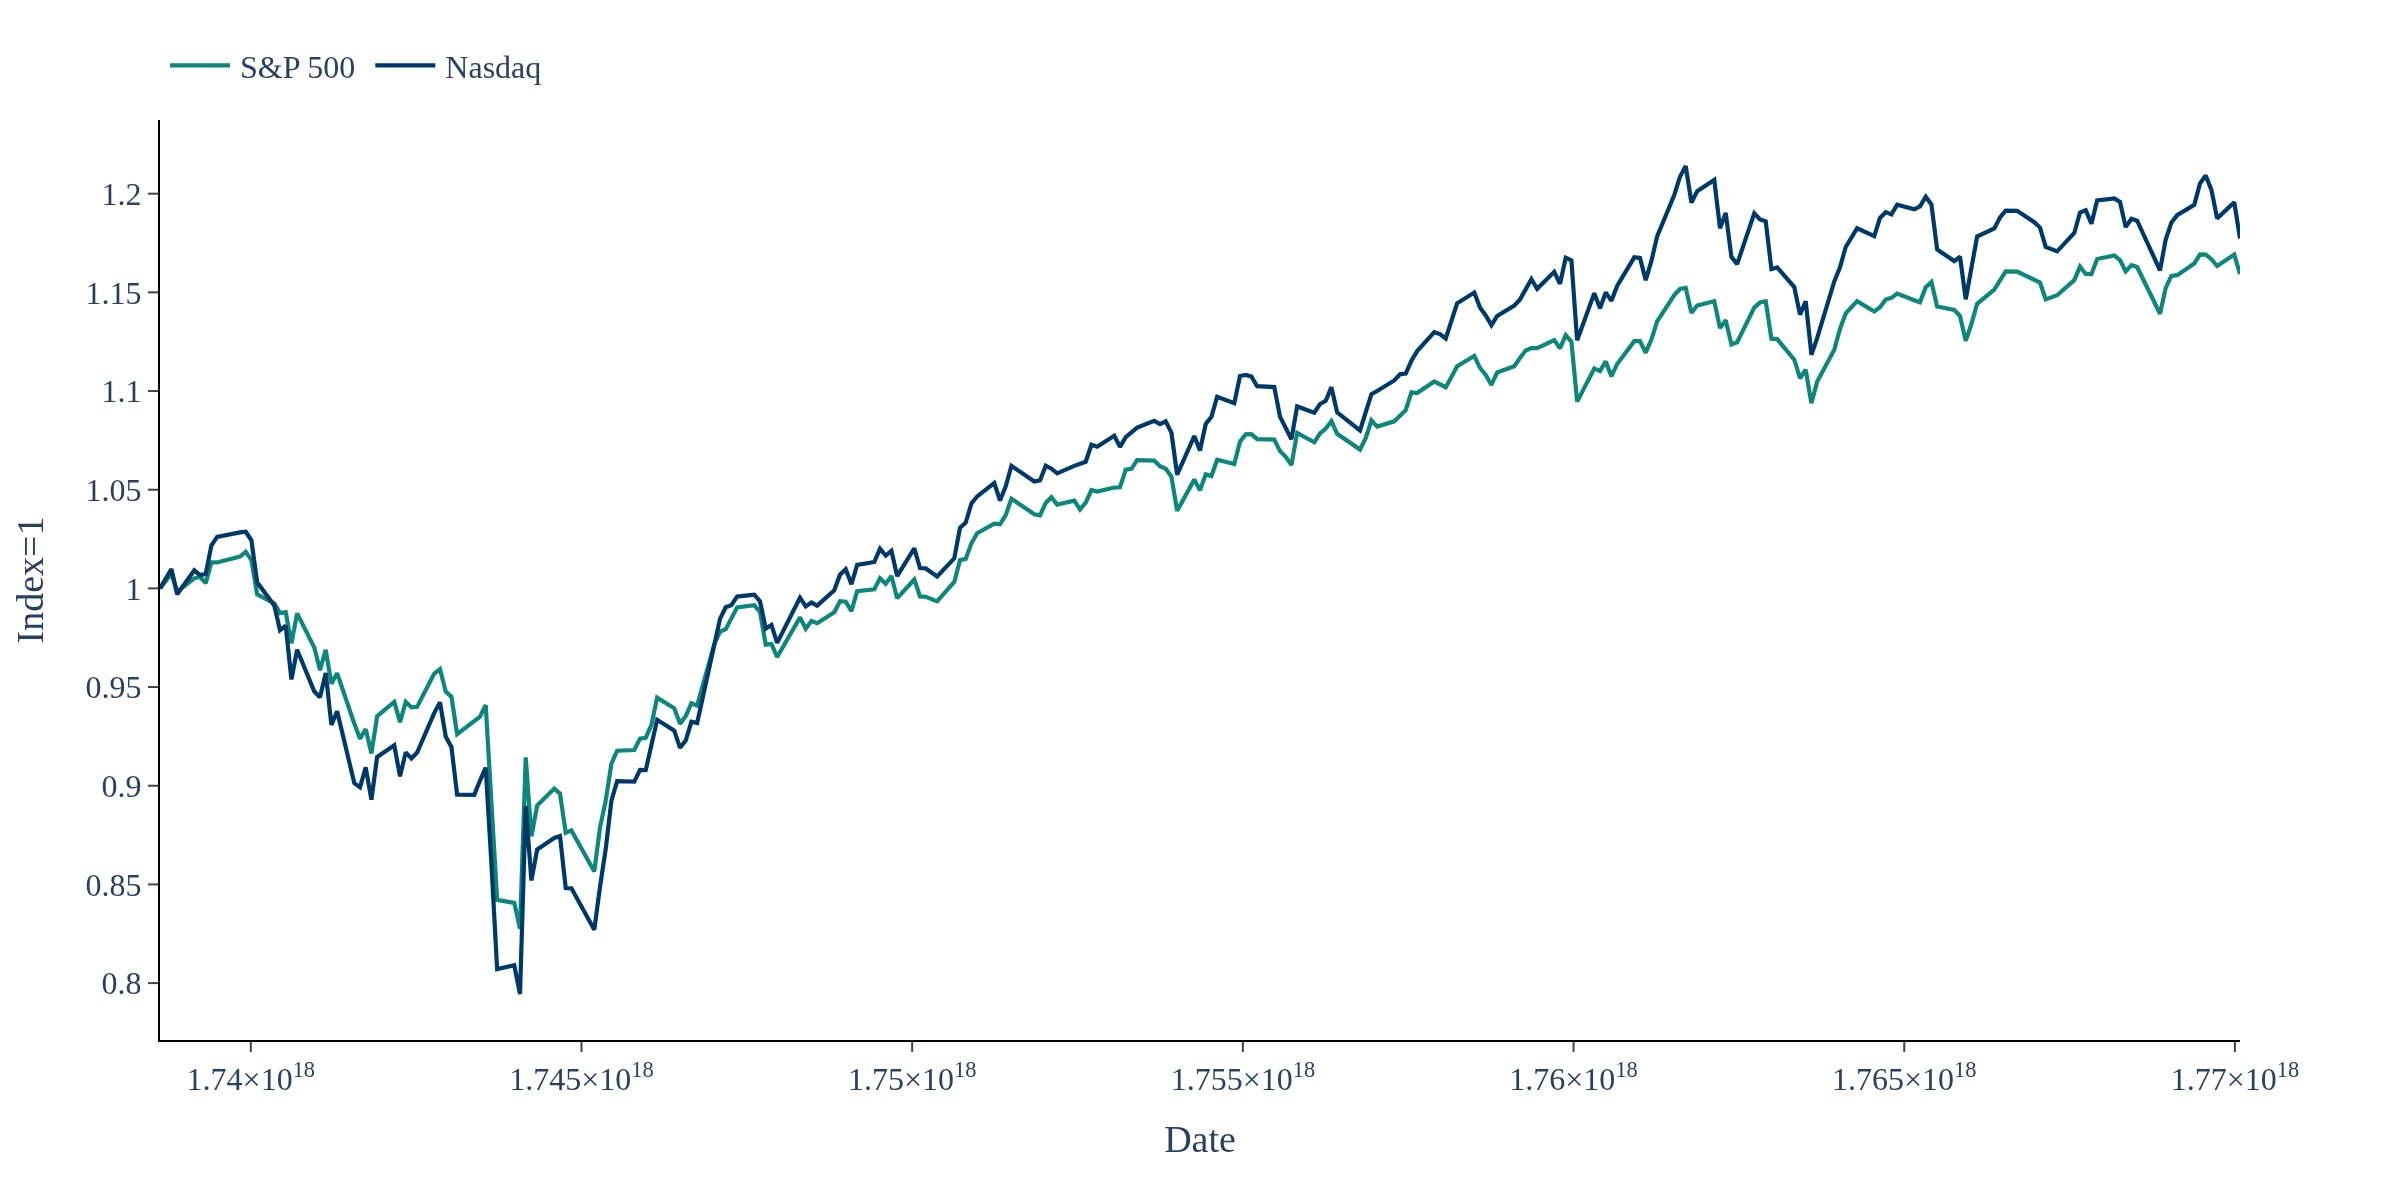
The S&P 500 Stocks Key Price Metrics dashboard allows you to monitor detailed performance metrics, including daily, monthly, and annual returns for each S&P 500 constituent. By utilizing daily adjusted prices, it provides insights into rolling volatility and trend indicators, helping investors assess stock performance over various time horizons.
This dashboard consolidates key metrics such as returns across multiple horizons, rolling volatility, historical drawdowns, and moving averages. These indicators enable investors to quickly identify leaders and laggards in the S&P 500, as well as assess risk concentration and momentum changes.
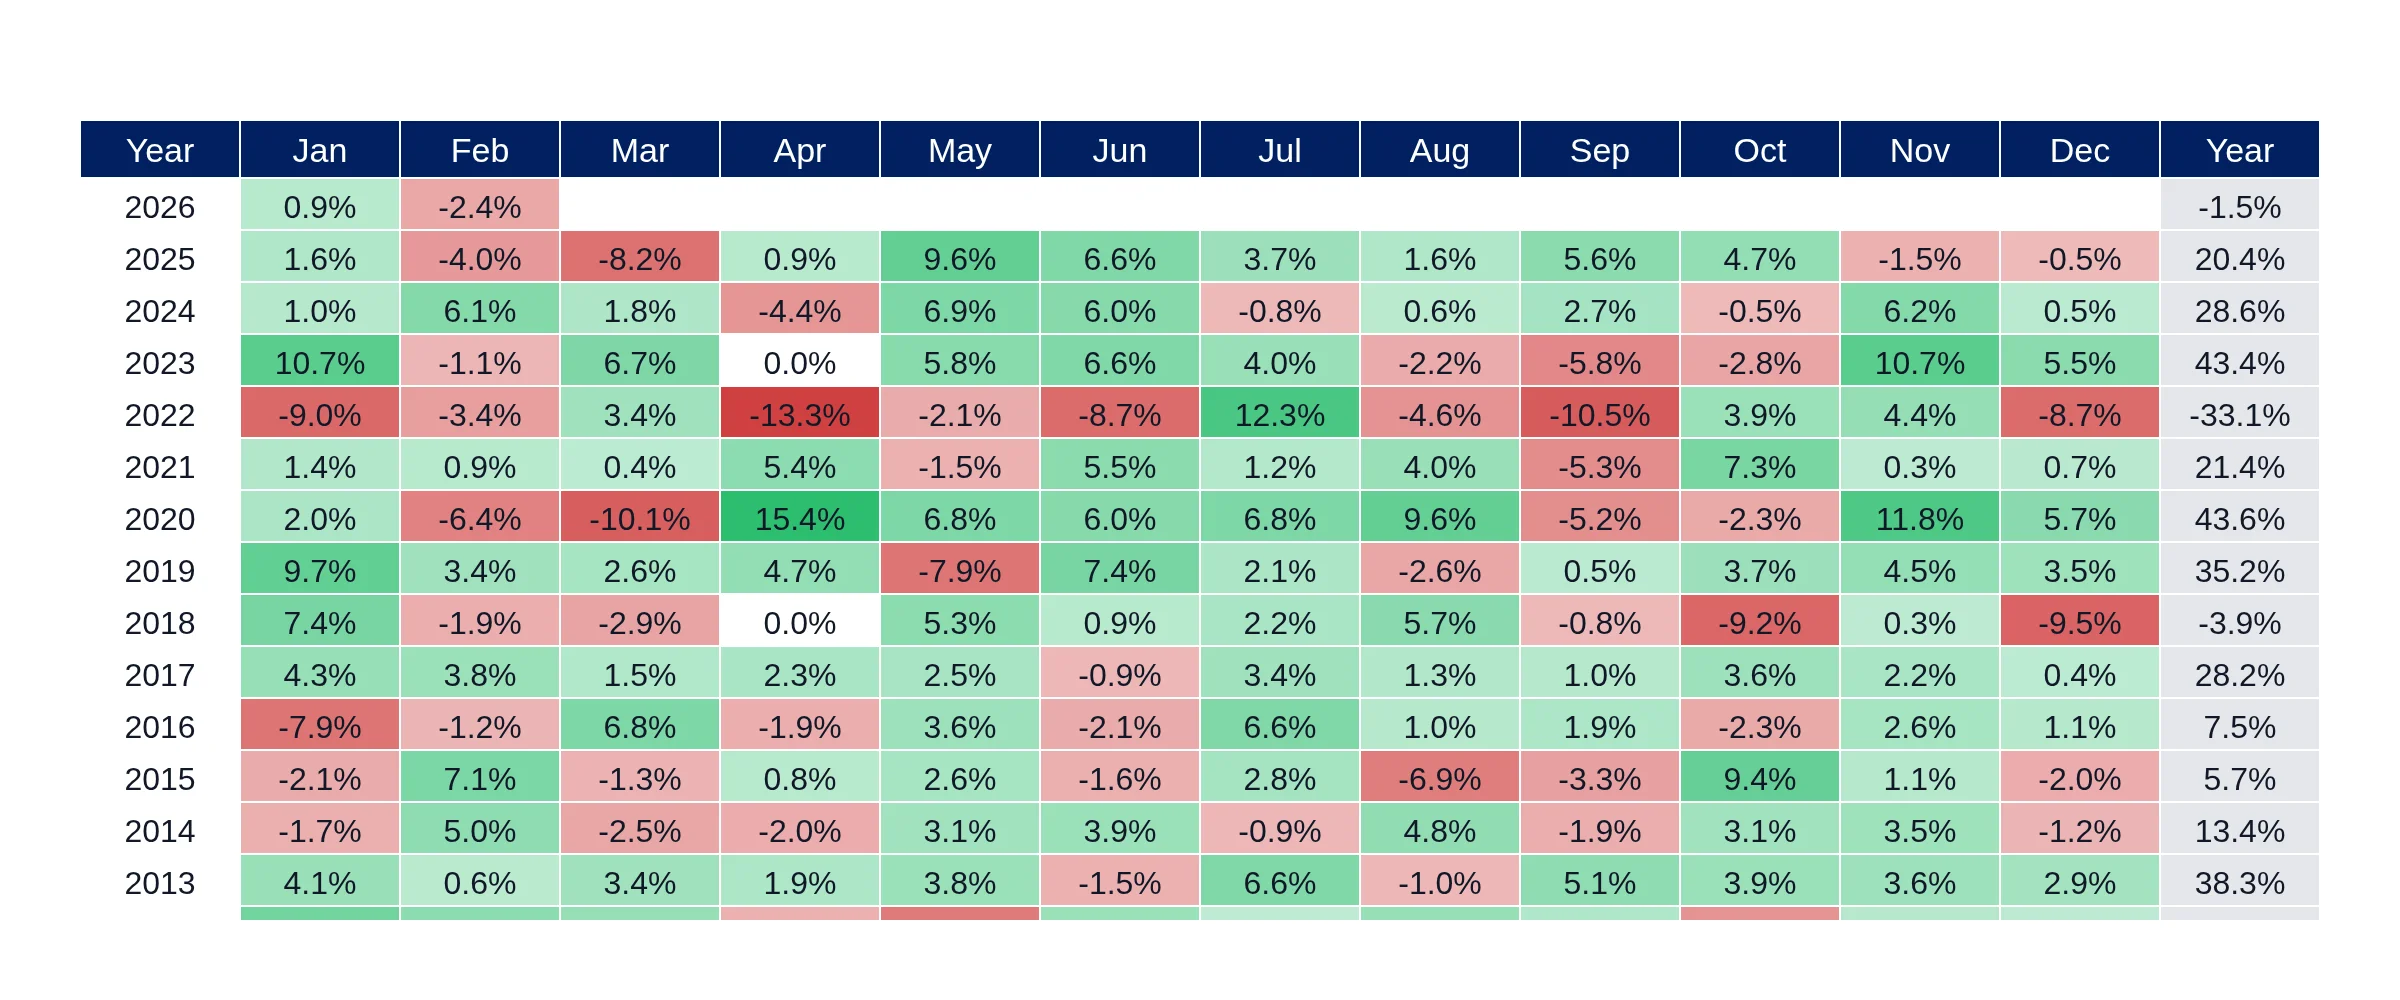
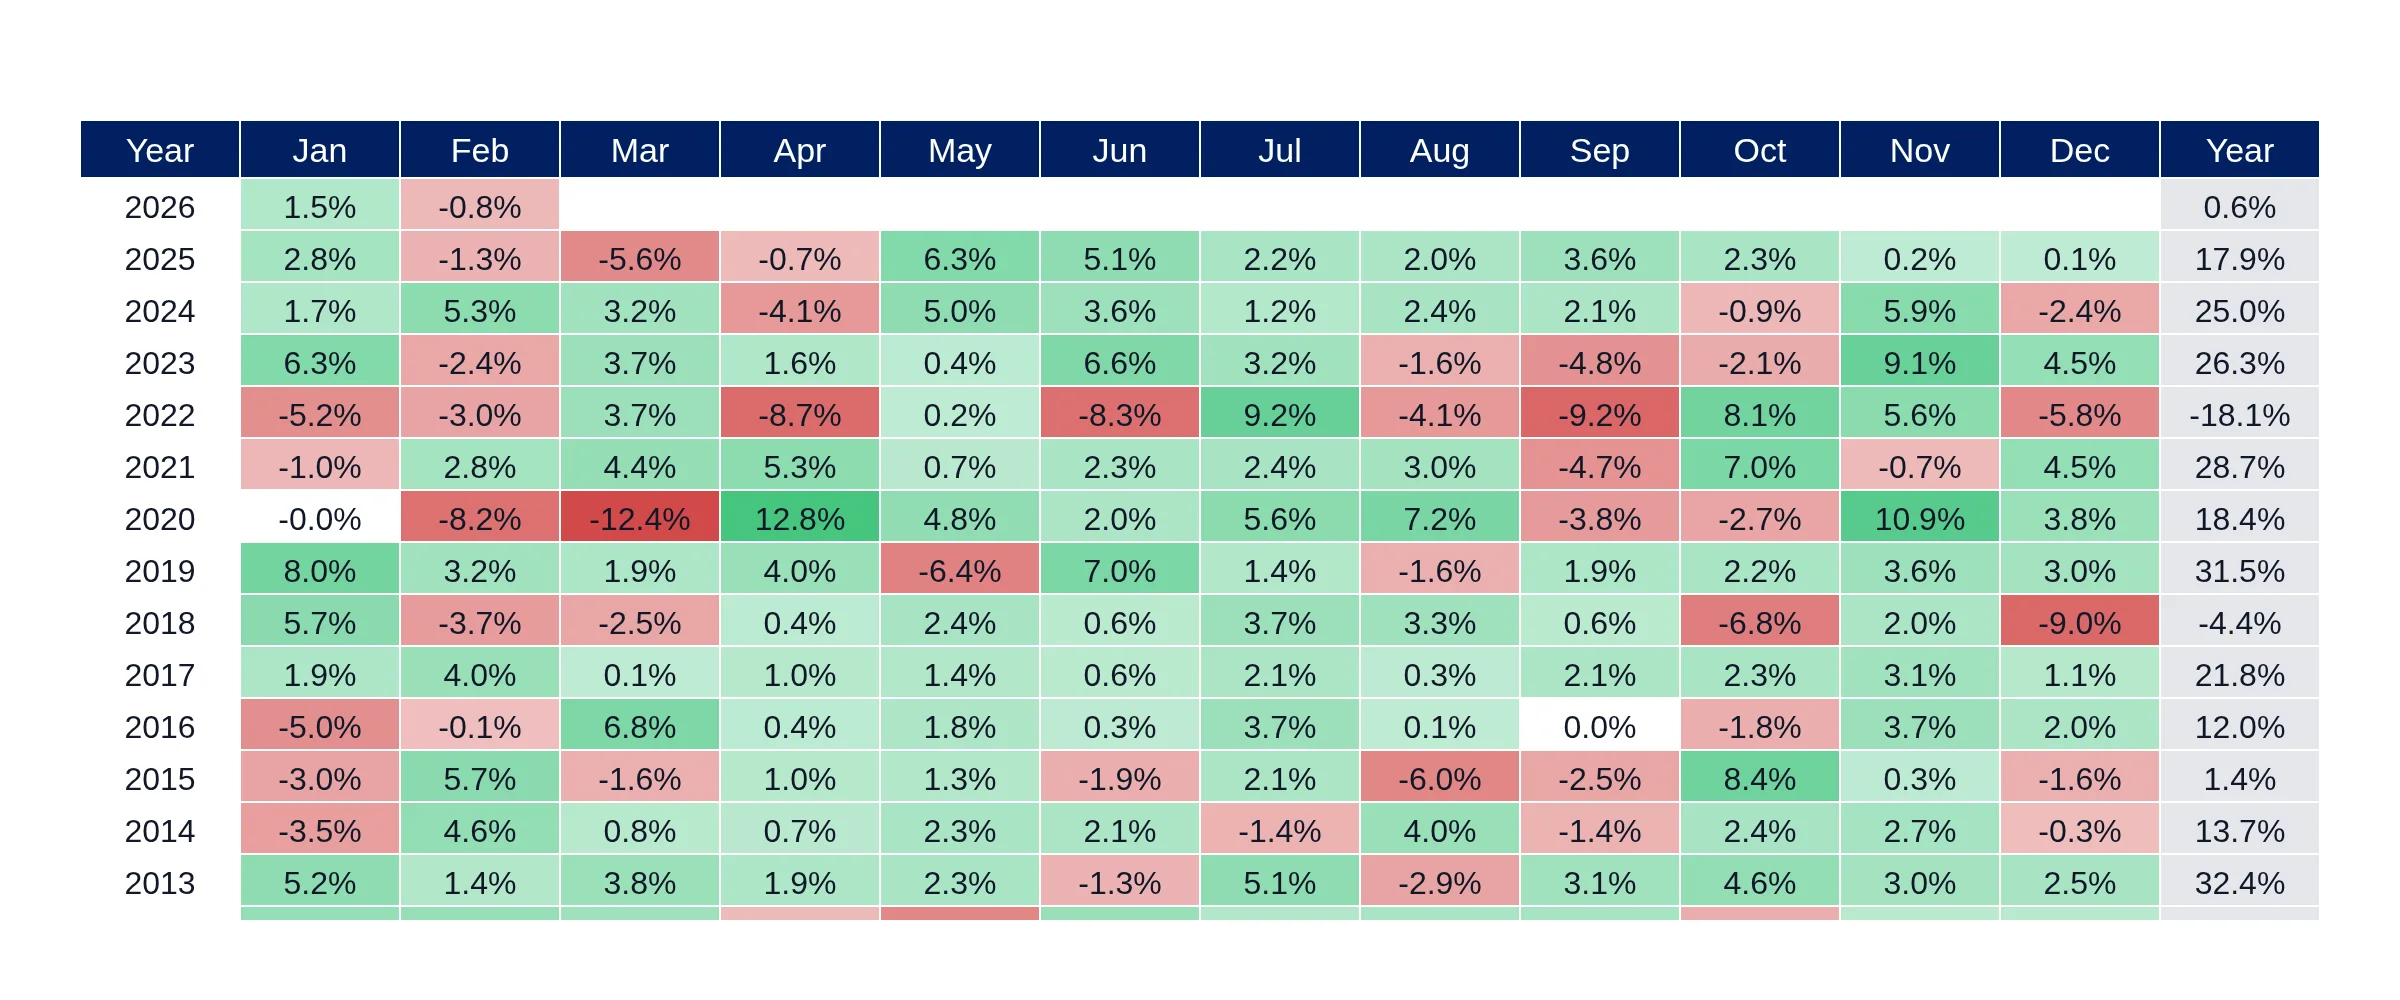
The S&P 500 Stocks Key Price Metrics dashboard summarizes annual and monthly returns, allowing investors to compare seasonality and consistency across stocks. By analyzing drawdowns and volatility, users can effectively identify stocks with high risk concentration and those exhibiting improving or deteriorating momentum.
This dashboard consolidates key S&P 500 stock price metrics into one view, combining performance and risk measures for every constituent. Using daily adjusted prices when available, it computes returns across multiple horizons, rolling volatility, current and historical drawdowns, and trend indicators such as moving averages. It also summarizes annual and monthly returns to compare seasonality and consistency across stocks. These indicators help quickly identify leaders and laggards, risk concentration, and names with improving or deteriorating momentum. The goal is fast, comparable S&P 500 stock screening for investors focused on price action, volatility and downside risk.