Dashboard consolidating the most relevant information pieces inside the US PPI data. Source: BLS — updated monthly.
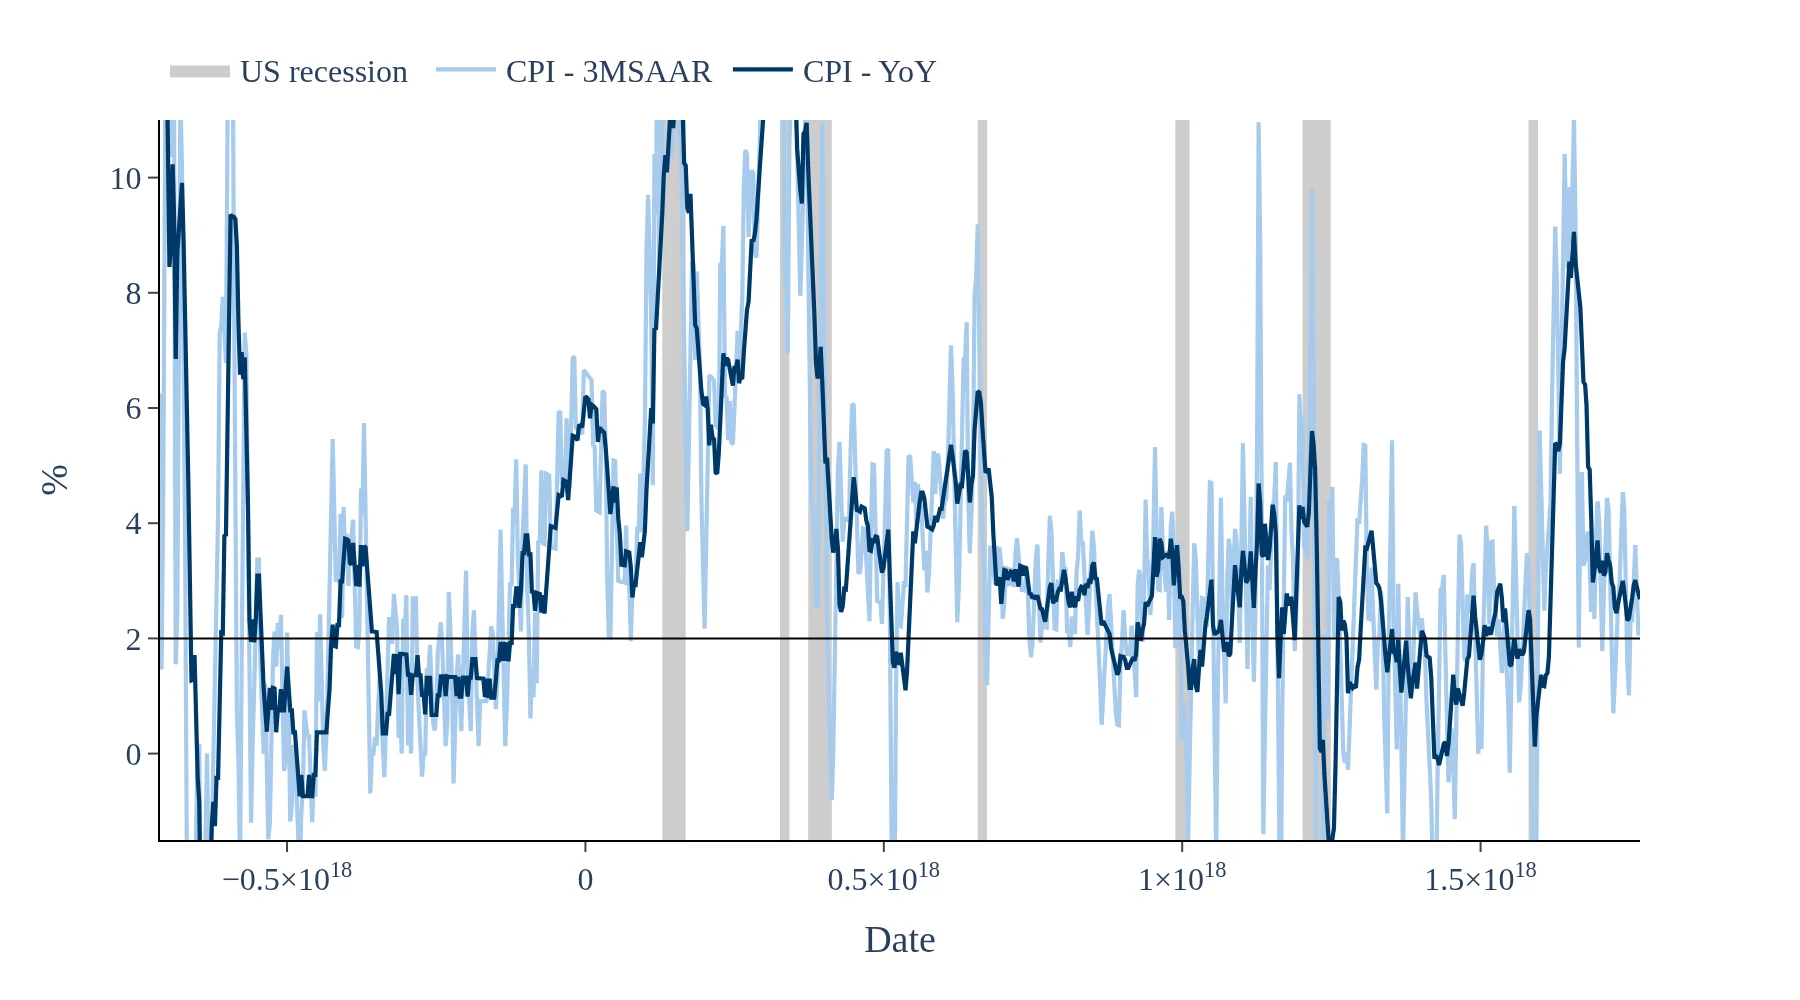
The US PPI Dashboard provides critical insights into the Producer Price Index (PPI), which measures price changes received by producers. By tracking headline and key underlying PPI measures over time, the dashboard highlights trends and turning points that can signal inflation pressures in the supply chain, helping analysts and investors anticipate movements in the Consumer Price Index (CPI).
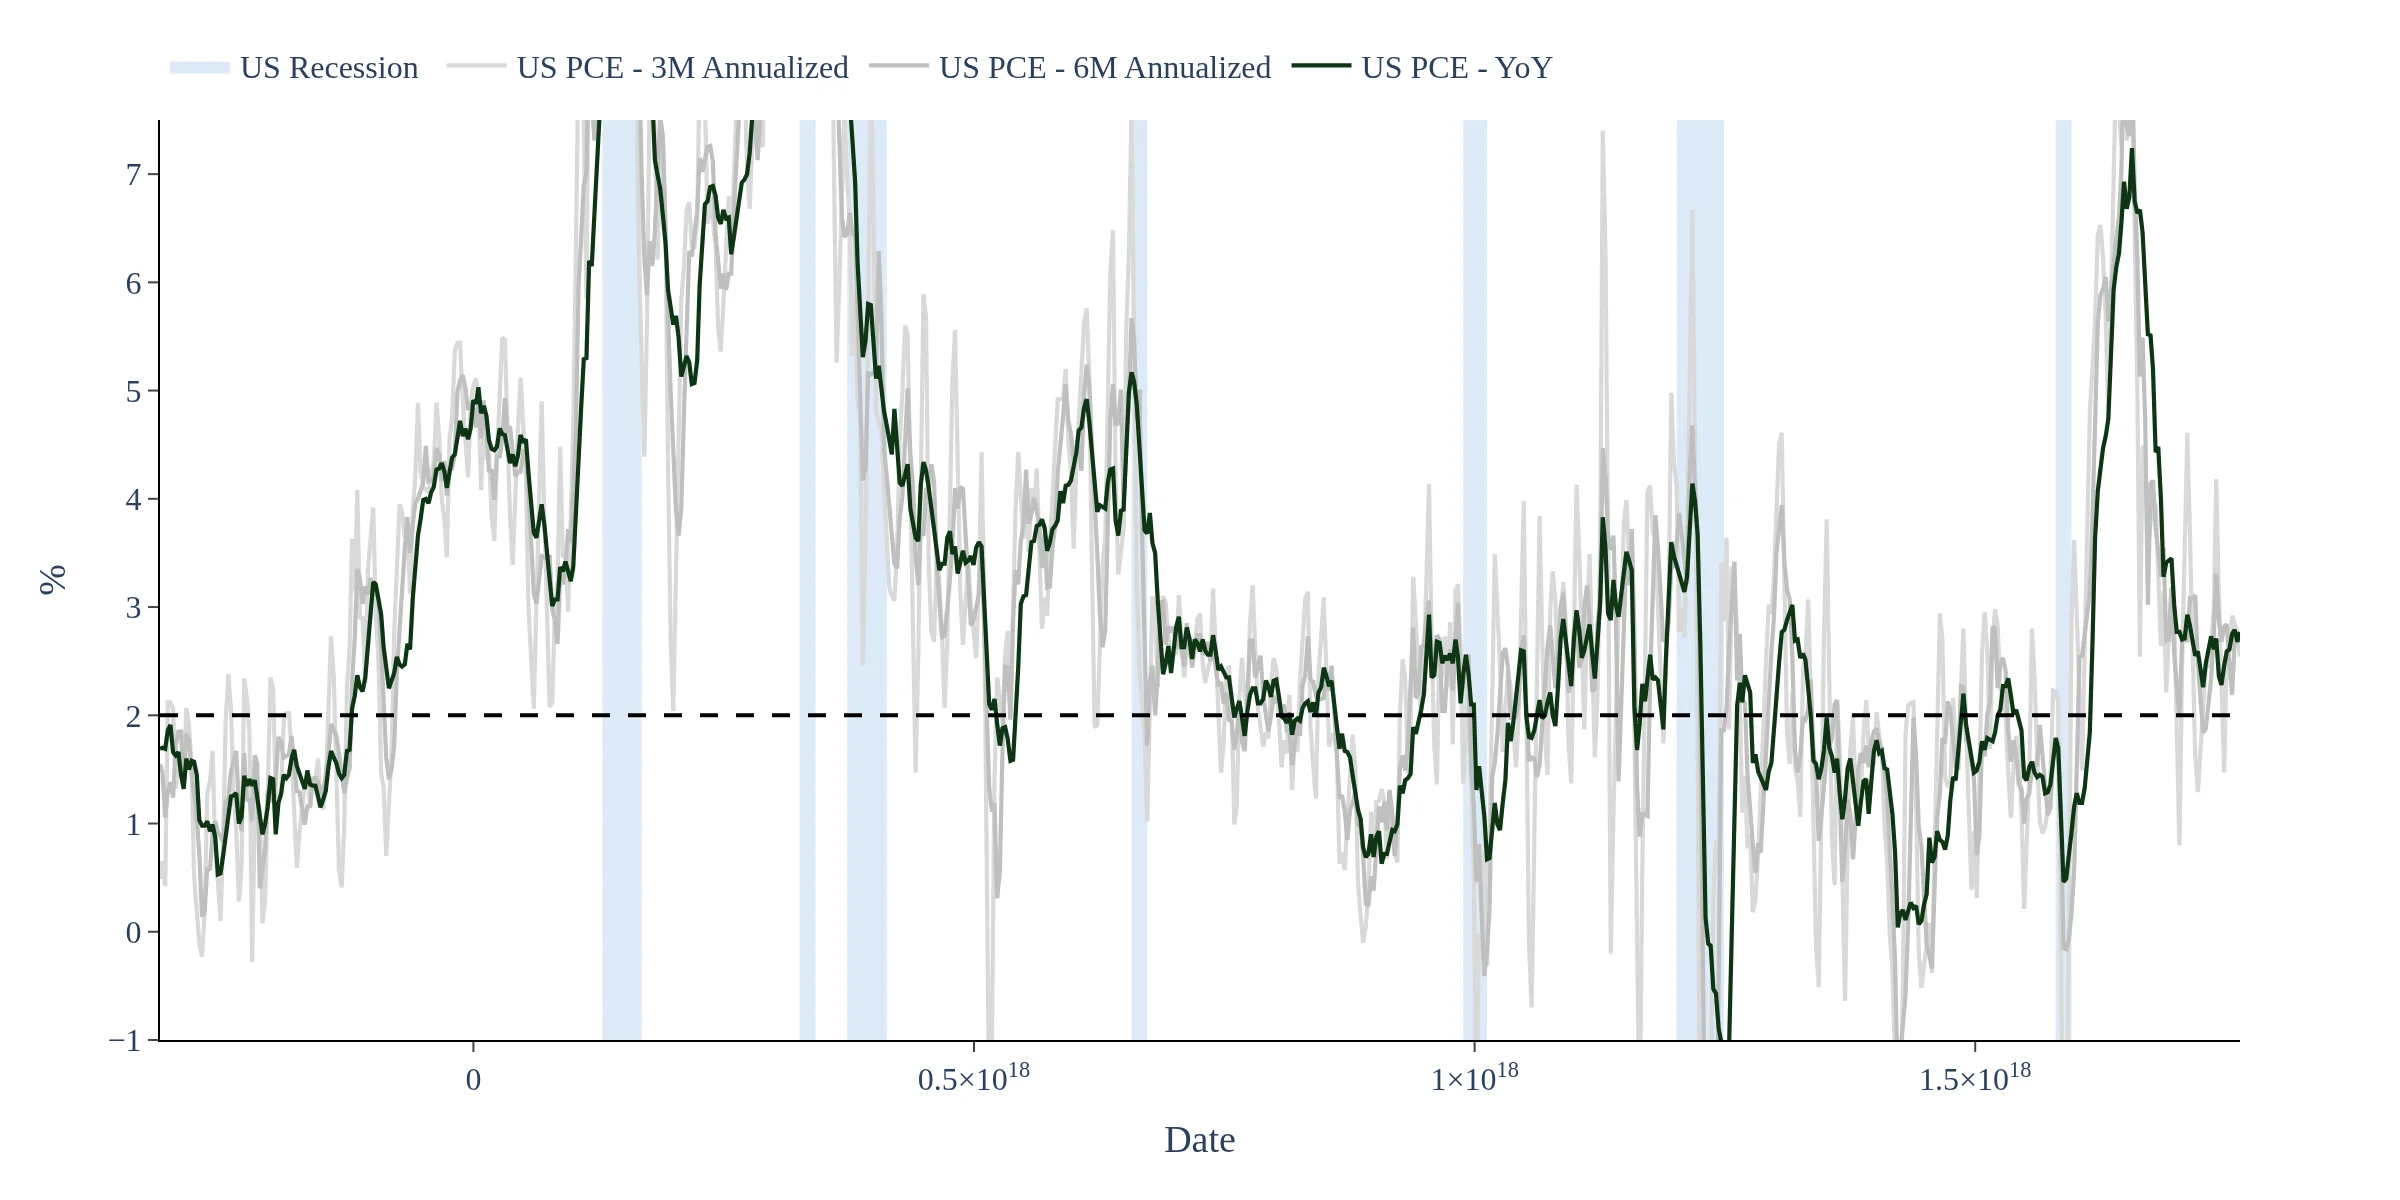
Excluding food and energy from the US PPI data allows for a clearer analysis of core inflation trends, as these categories can be highly volatile. The US PPI Dashboard features a specific chart for Final Demand Excluding Food & Energy, which helps investors assess underlying inflation pressures without the noise of fluctuating prices in these essential sectors.
The US PPI Dashboard is updated monthly following each release of the Producer Price Index data by the Bureau of Labor Statistics (BLS). This ensures that traders and analysts have access to the most current information on producer inflation, allowing for timely assessments of potential impacts on corporate margins and Federal Reserve policy.
This dashboard tracks the US Producer Price Index (PPI) using official data published by the Bureau of Labor Statistics (BLS). PPI measures price changes received by producers and often provides early signals about inflation pressures in the supply chain. The dashboard follows headline and key underlying PPI measures over time to highlight trends, turning points and periods of accelerating or easing producer inflation. Data is updated after each monthly BLS PPI release and presented with clear historical context for interpretation. Use it to monitor upstream inflation risks and assess implications for CPI, corporate margins, Fed policy and markets.