Dashboard consolidating performance measures for sector ETFs in the US.
The US Equities Sectors Monitor tracks sector performance using highly liquid sector ETFs as proxies for each S&P 500 sector, such as XLB for Materials and XLF for Financials. Prices reflect price return only, excluding dividends, and the data is automatically refreshed to display comparable sector return series over time.
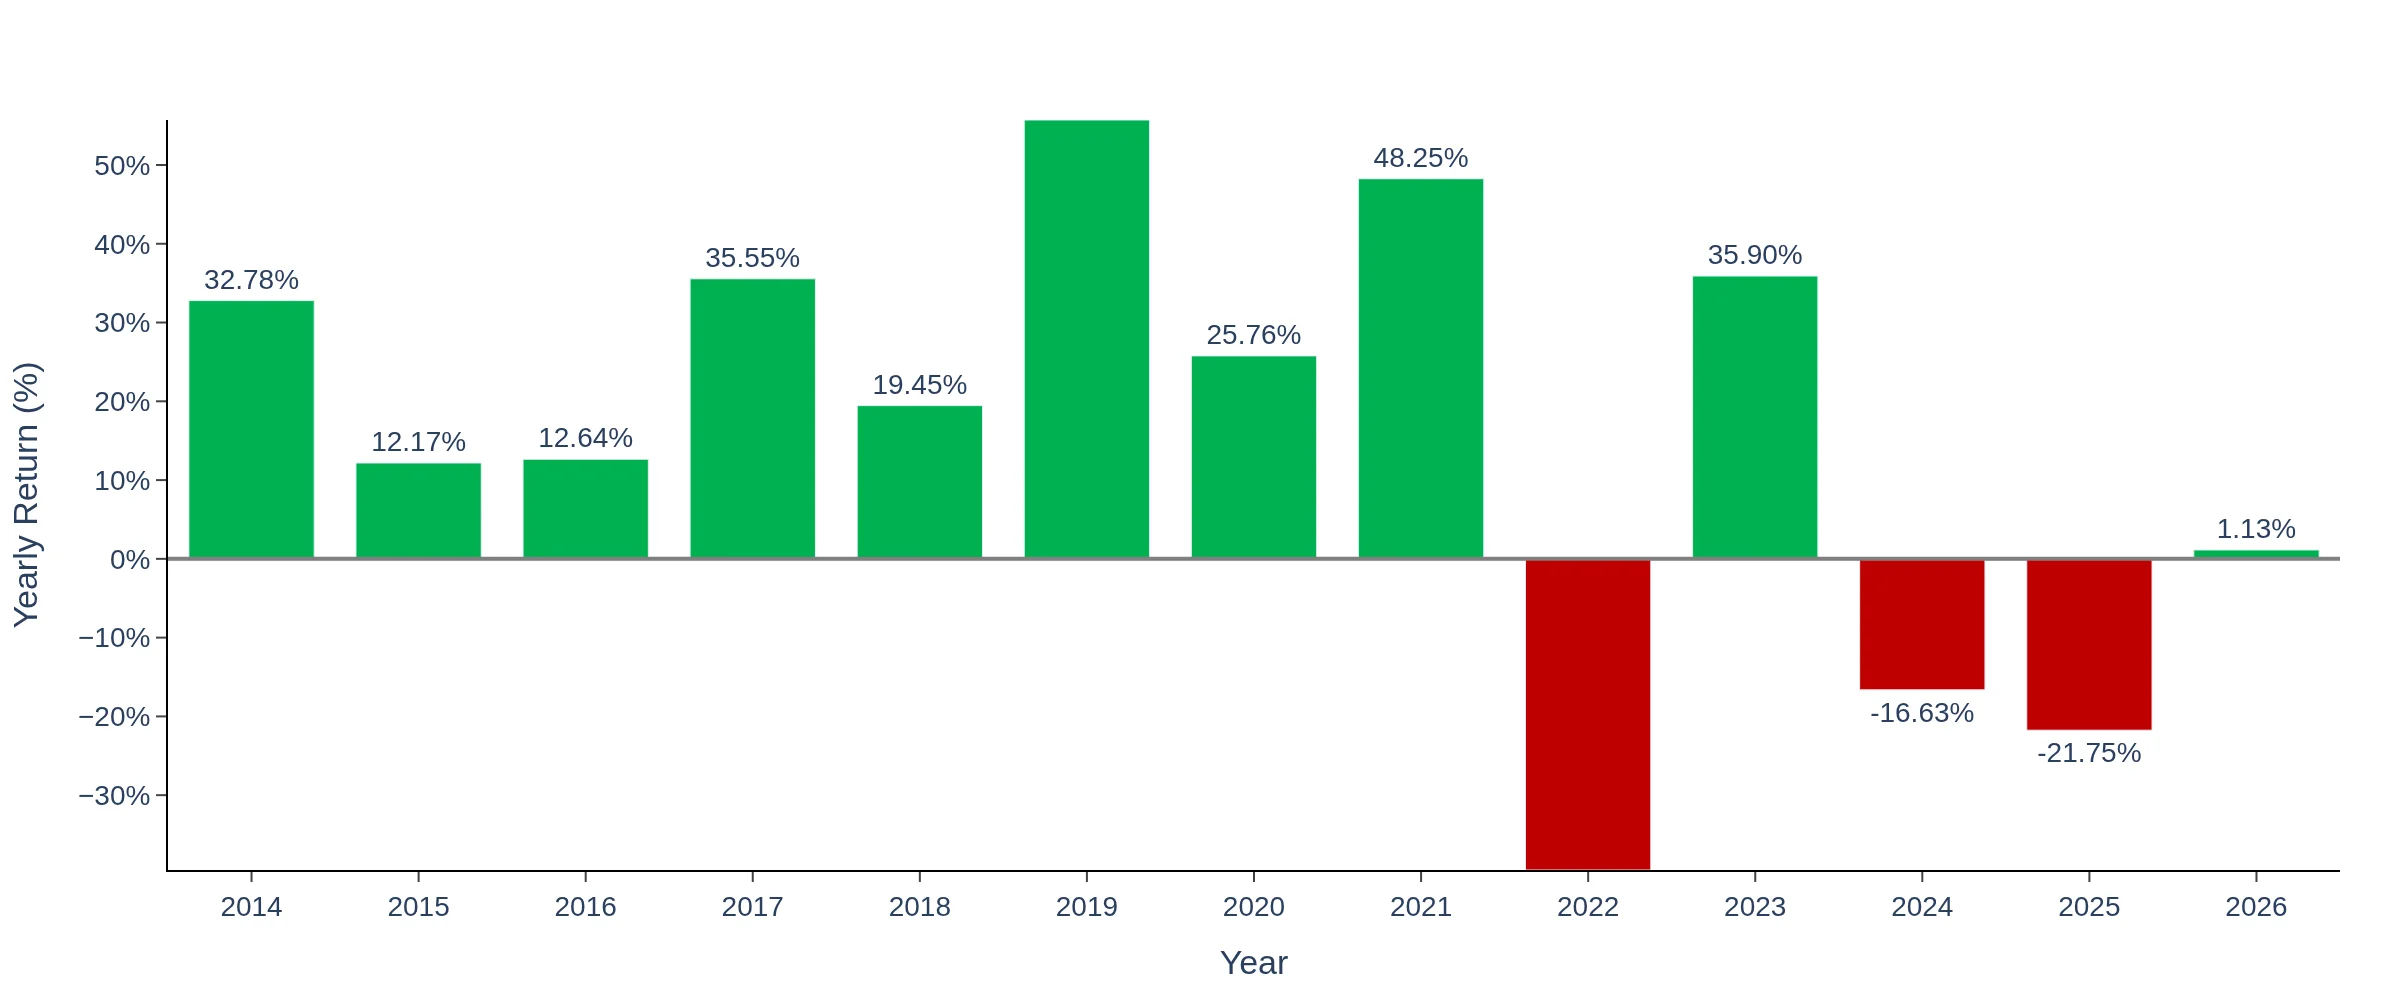
The dashboard provides various performance measures, including yearly, monthly, and daily returns for sector ETFs in the US equity market. Each chart displays performance in percentage terms, allowing investors to analyze trends across sectors like Technology (XLK) and Consumer Discretionary (XLY).
Historical coverage may vary by sector on the US Equities Sectors Monitor due to differences in ETF launch dates. For instance, newer ETFs may not have extensive historical data, impacting the ability to analyze long-term performance trends for sectors like Real Estate (XLRE) or Communication Services (XLC).
This dashboard tracks U.S. equity sector performance using highly liquid sector ETFs as proxies for each S&P 500 sector (e.g., XLB, XLE, XLF, XLI, XLK, XLP, XLU, XLV, XLY, XLRE, XLC). Prices reflect price return only (they do not include dividends, so they are not total returns). Each ETF is mapped to its corresponding sector classification: Materials (XLB), Energy (XLE), Financials (XLF), Industrials (XLI), Technology (XLK), Consumer Staples (XLP), Utilities (XLU), Health Care (XLV), Consumer Discretionary (XLY), Real Estate (XLRE), and Communication Services (XLC). Data is refreshed automatically and displayed as comparable sector return series over time. Because ETFs have different launch dates, historical coverage can vary by sector.
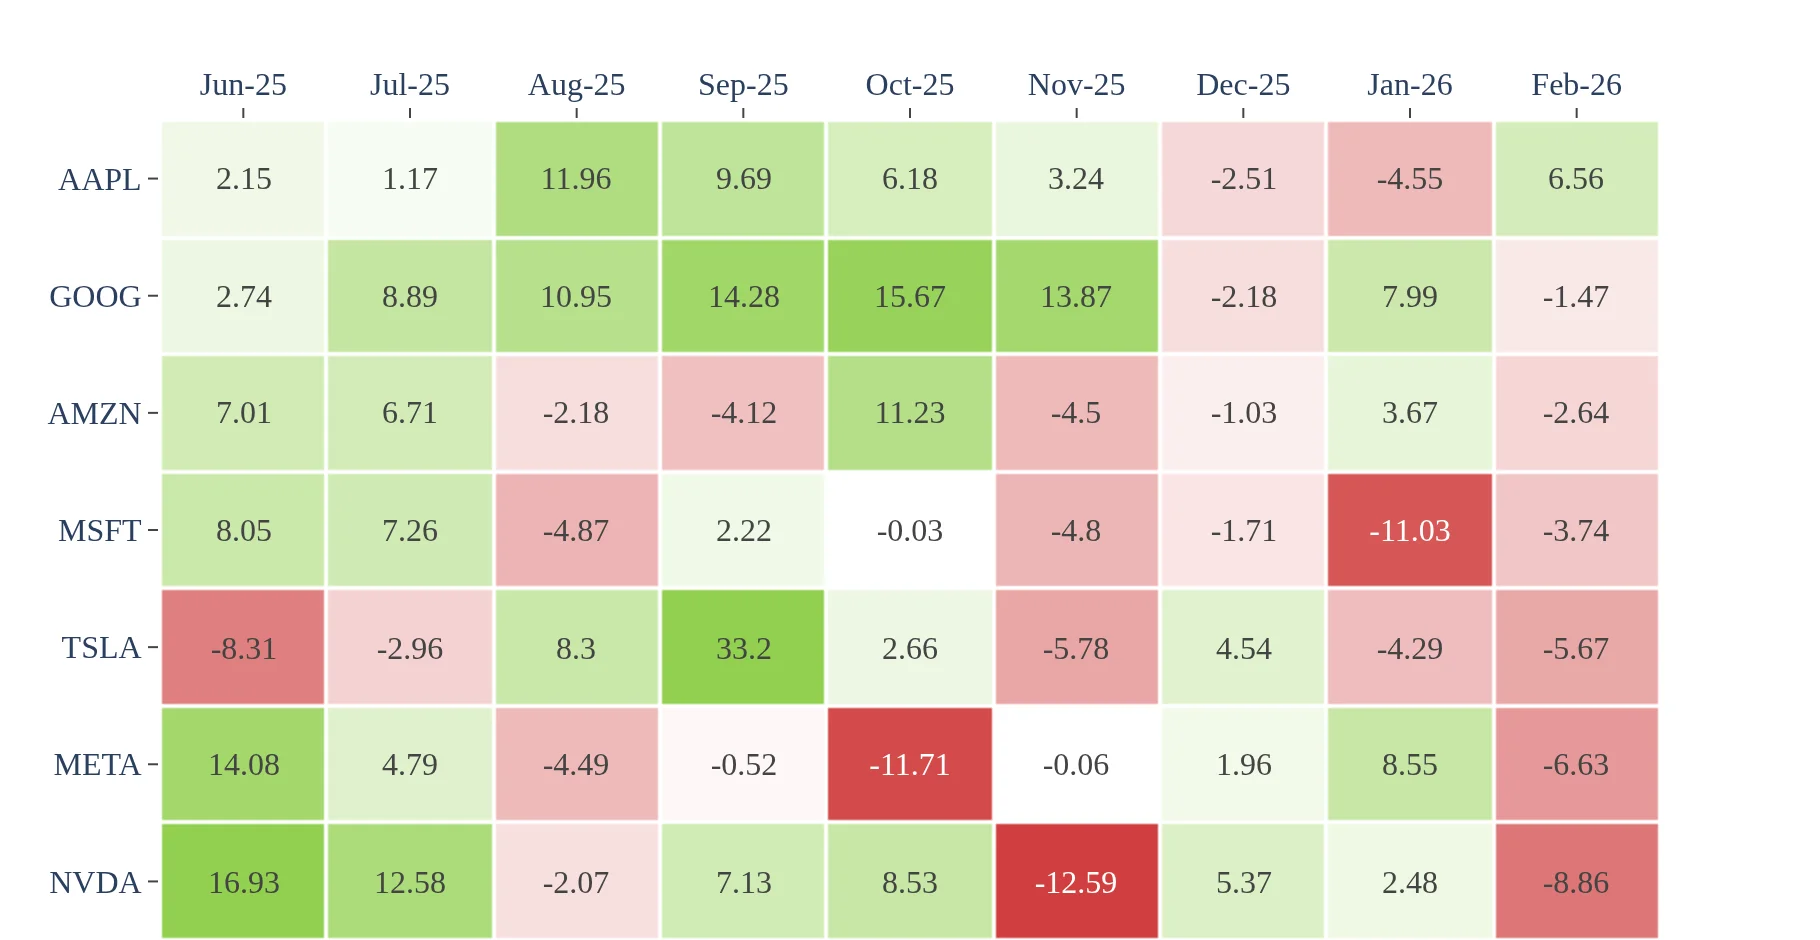
Track performance measures for the magnificent seven stocks
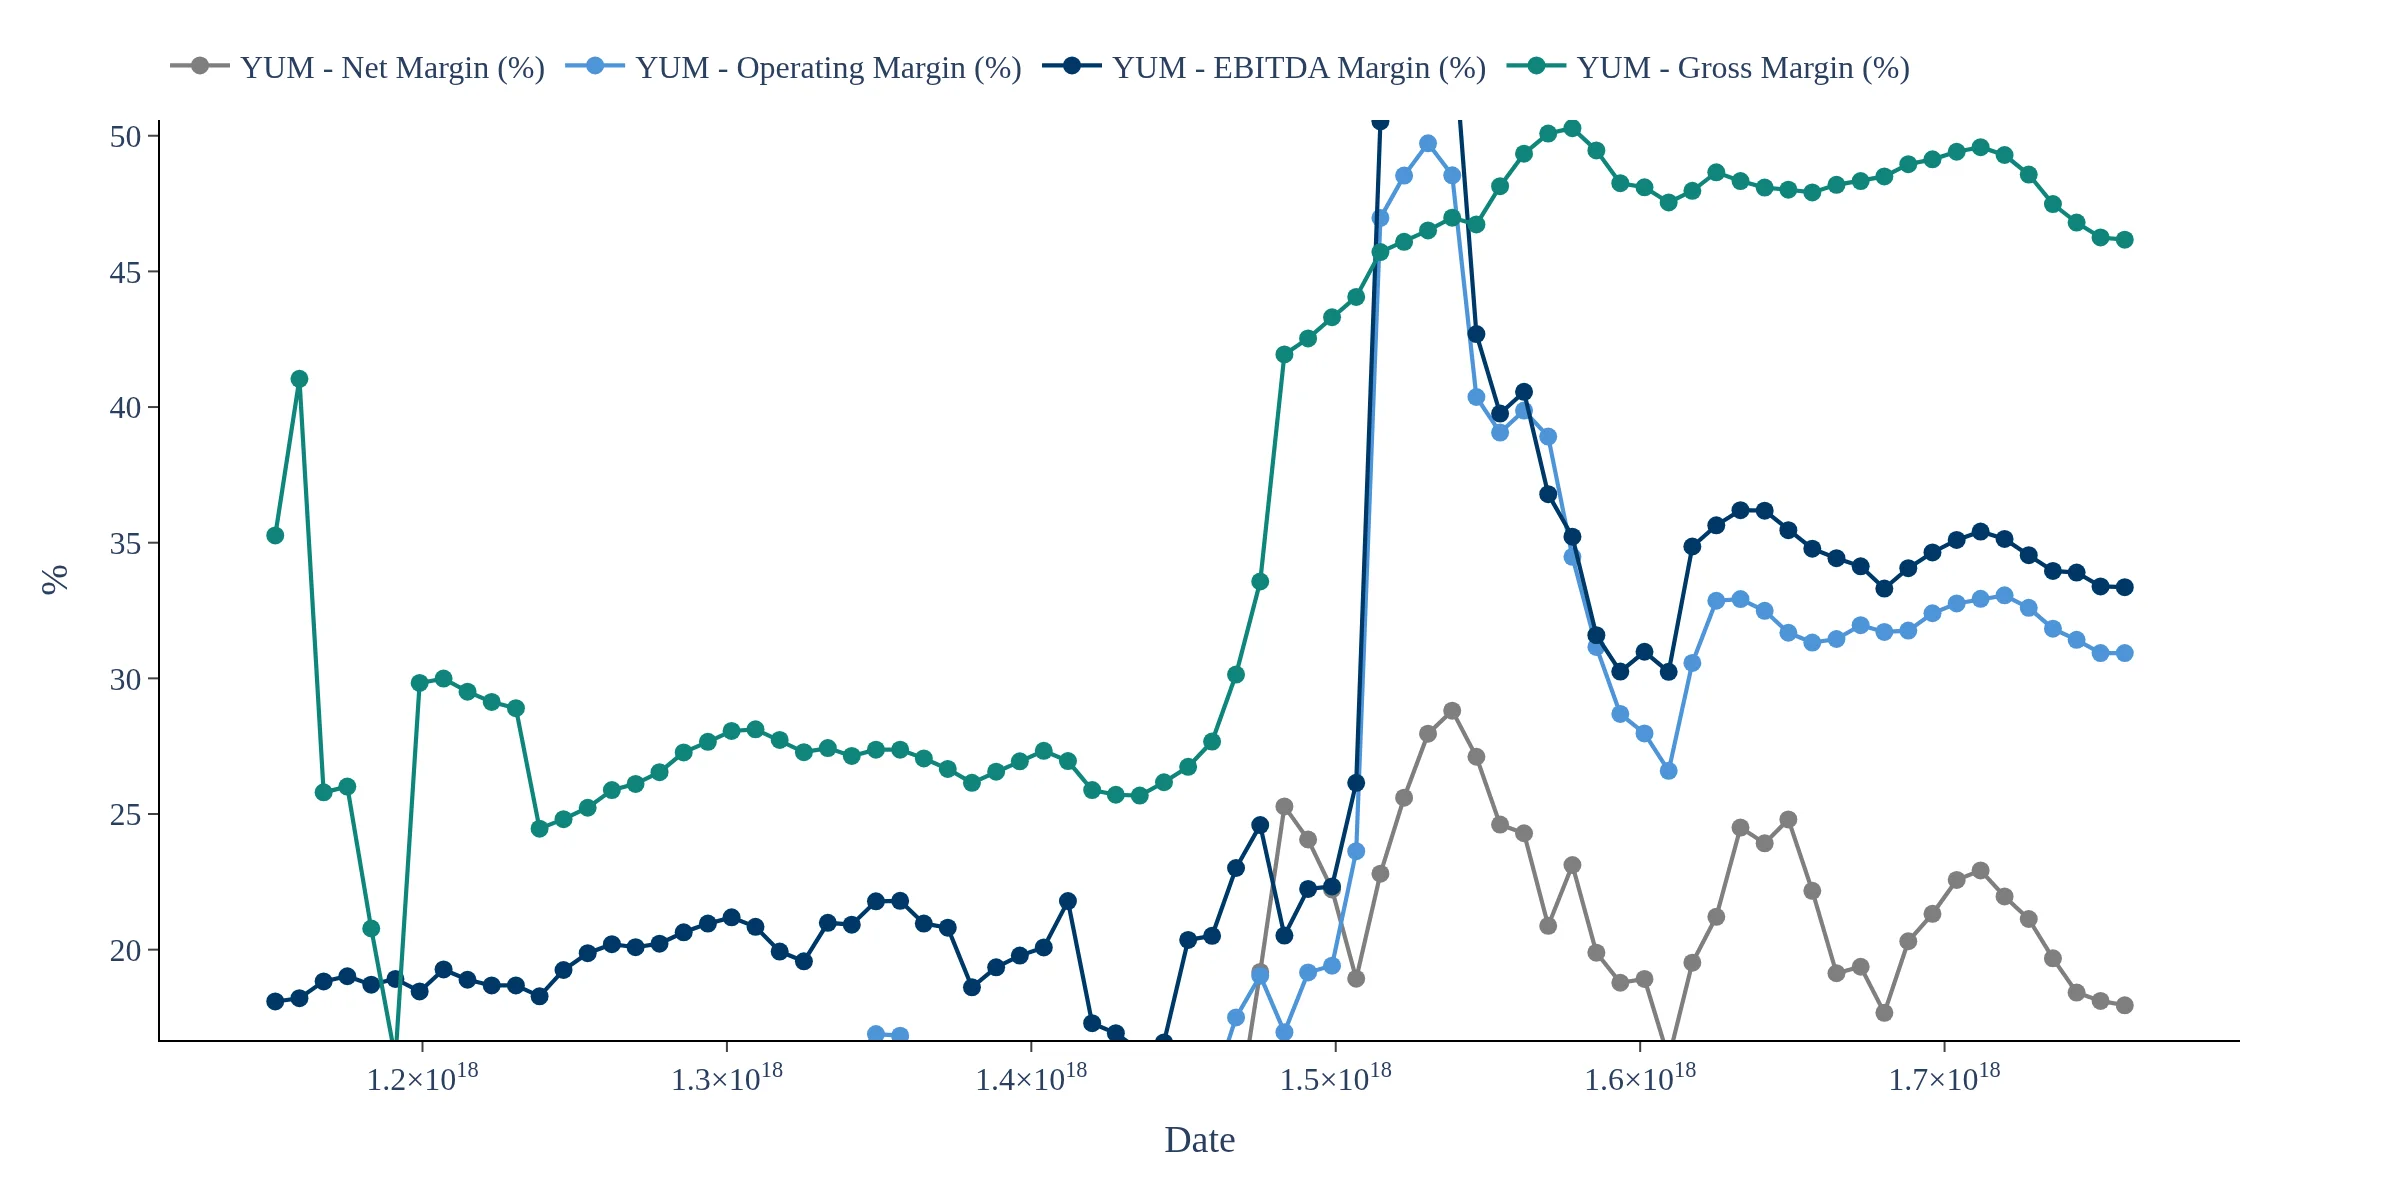
Track quarterly financials for all the stocks in the S&P 500 - Interactive charts with downloadable data
Track price and risk metrics for all the companies inside the S&P 500