Monitor detailed performance and risk metrics for the most important macro assets around the globe.
The Global Assets Tracking dashboard consolidates key metrics like multi-horizon returns, rolling volatility, and trend indicators, allowing investors to quickly identify market leaders and laggards. By monitoring these metrics across major macro assets, you can effectively gauge regime shifts and changes in risk conditions in equities, commodities, and FX markets.
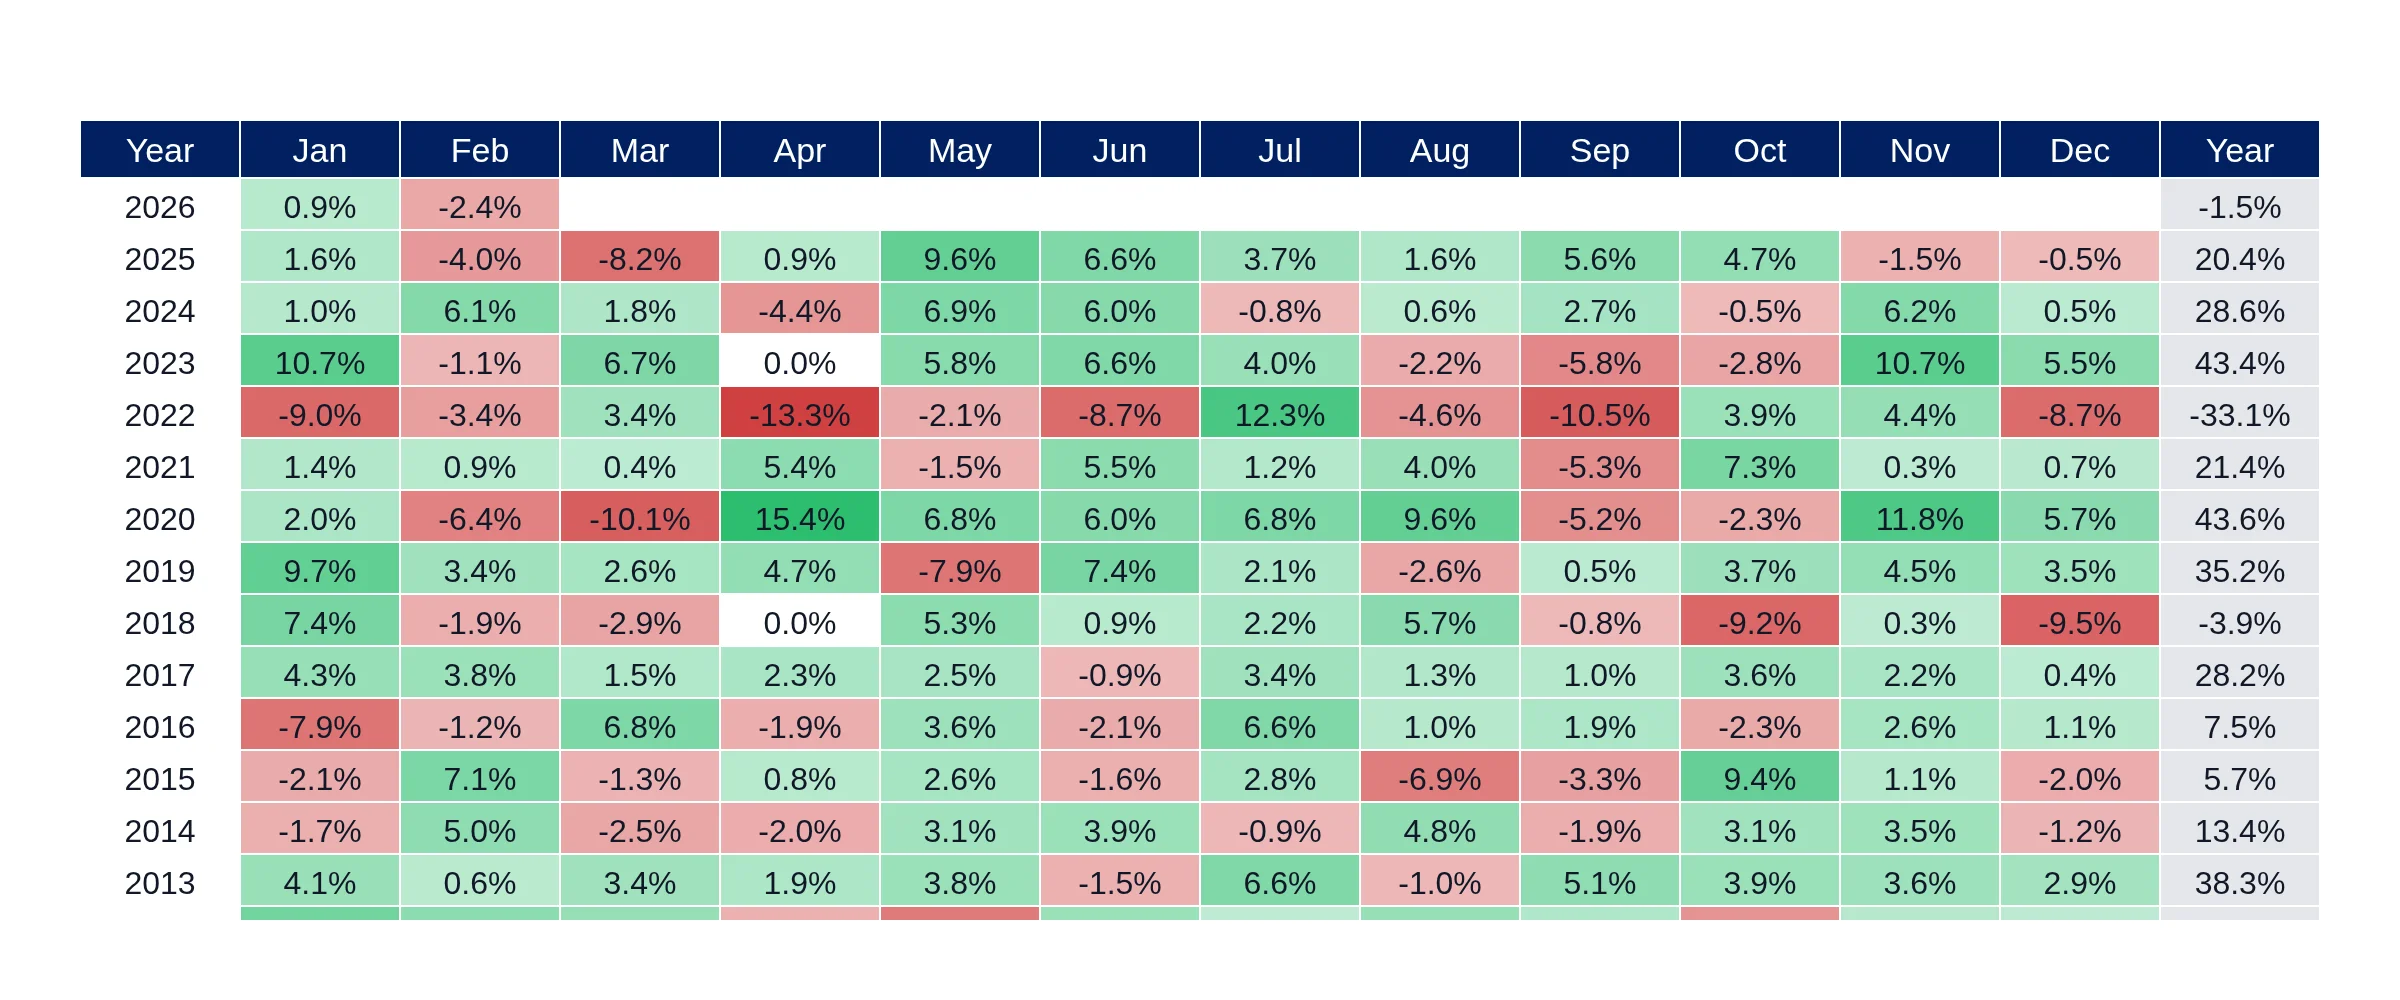
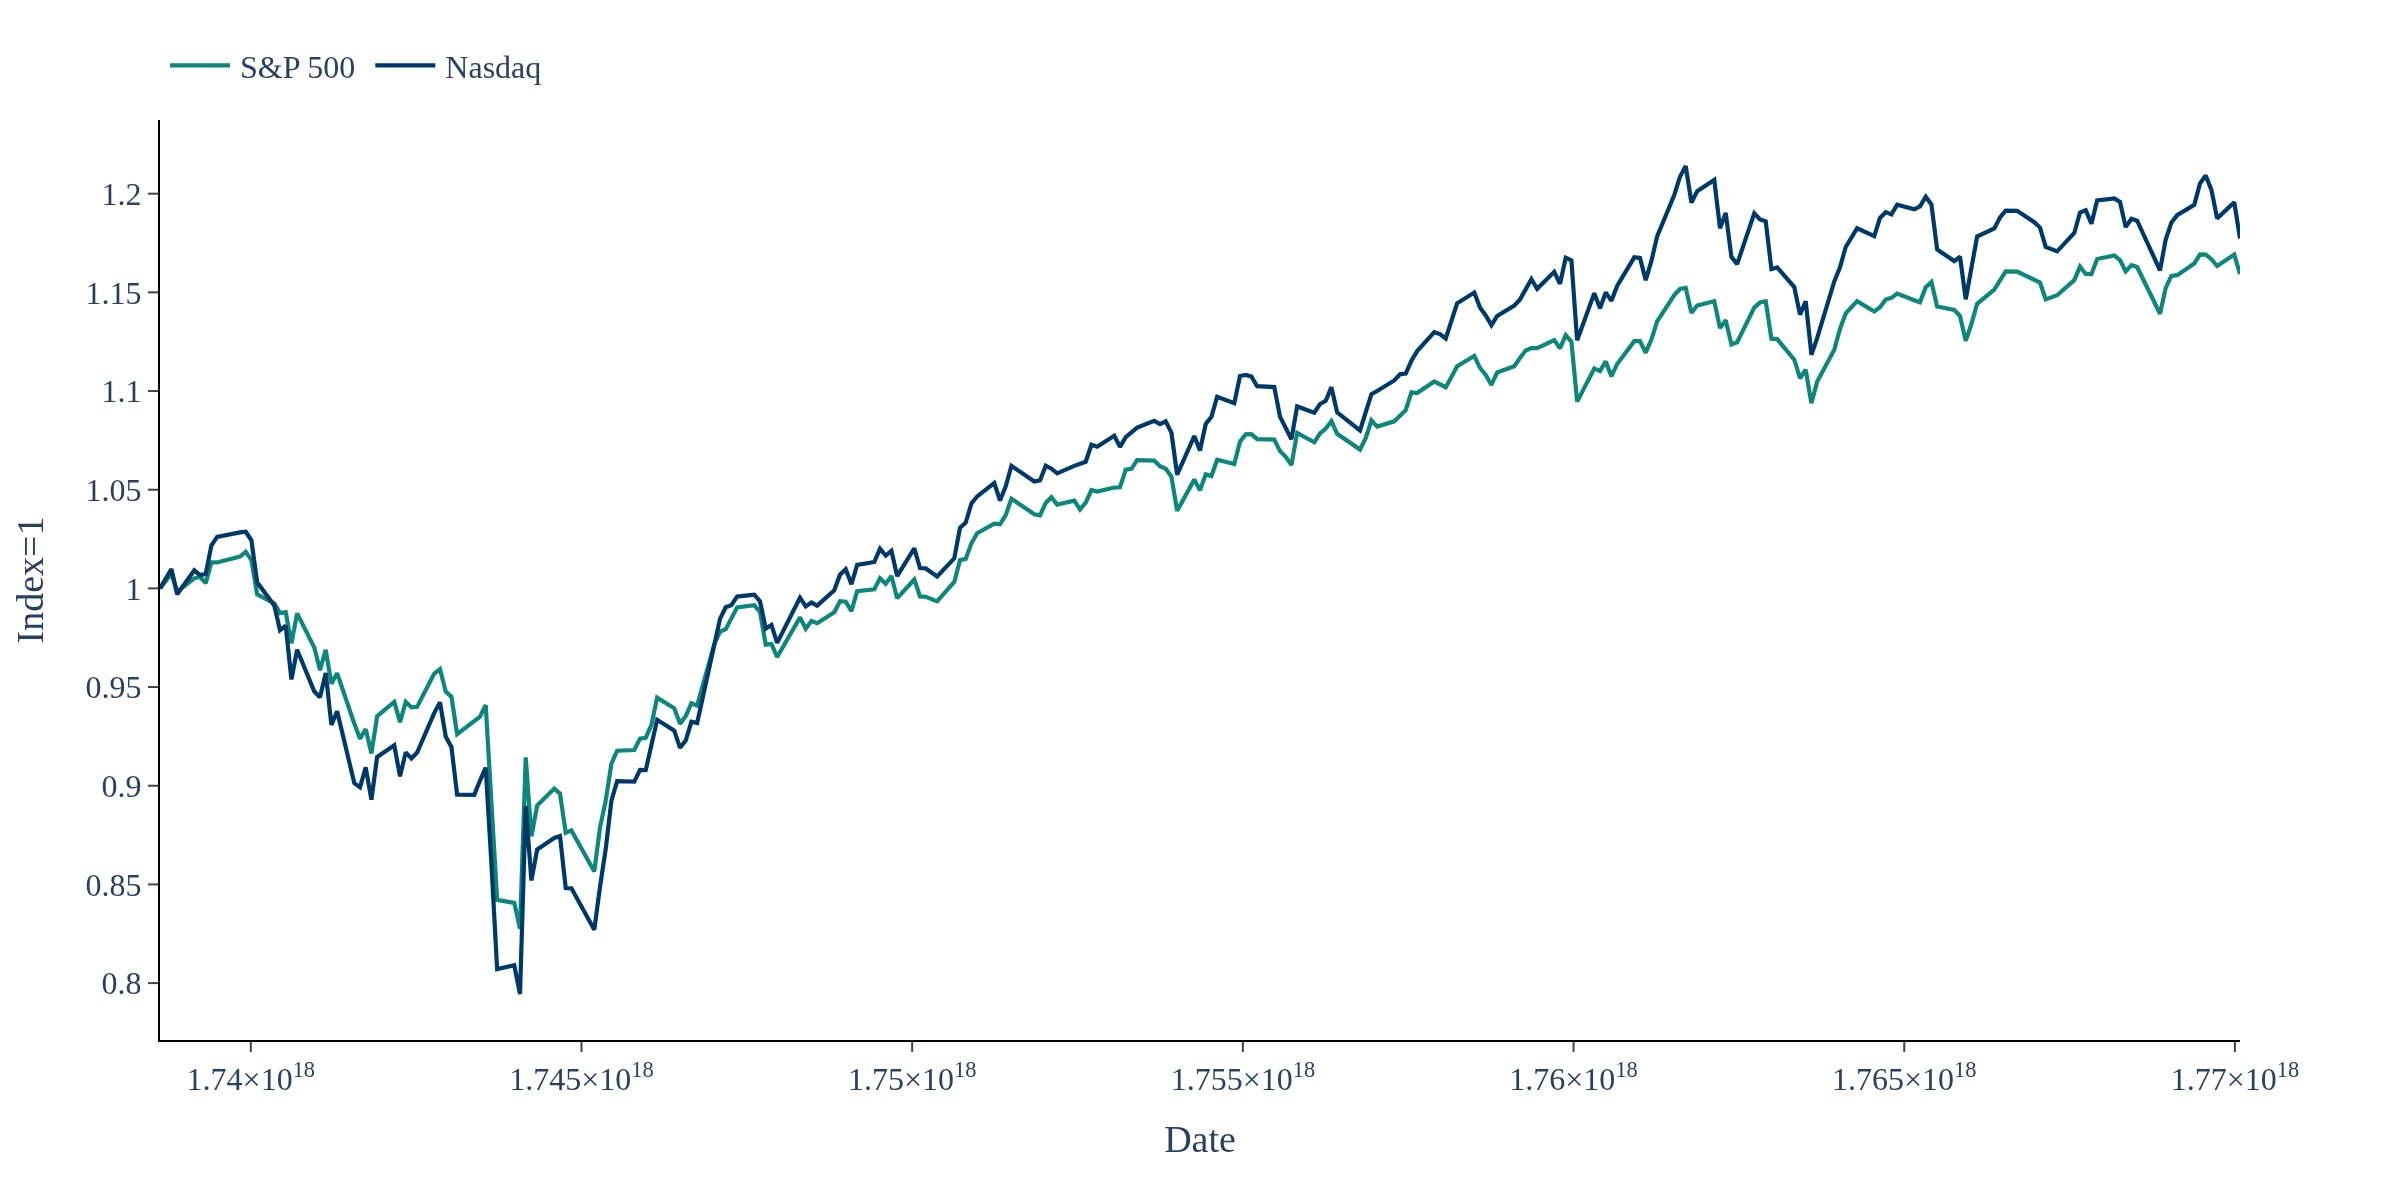
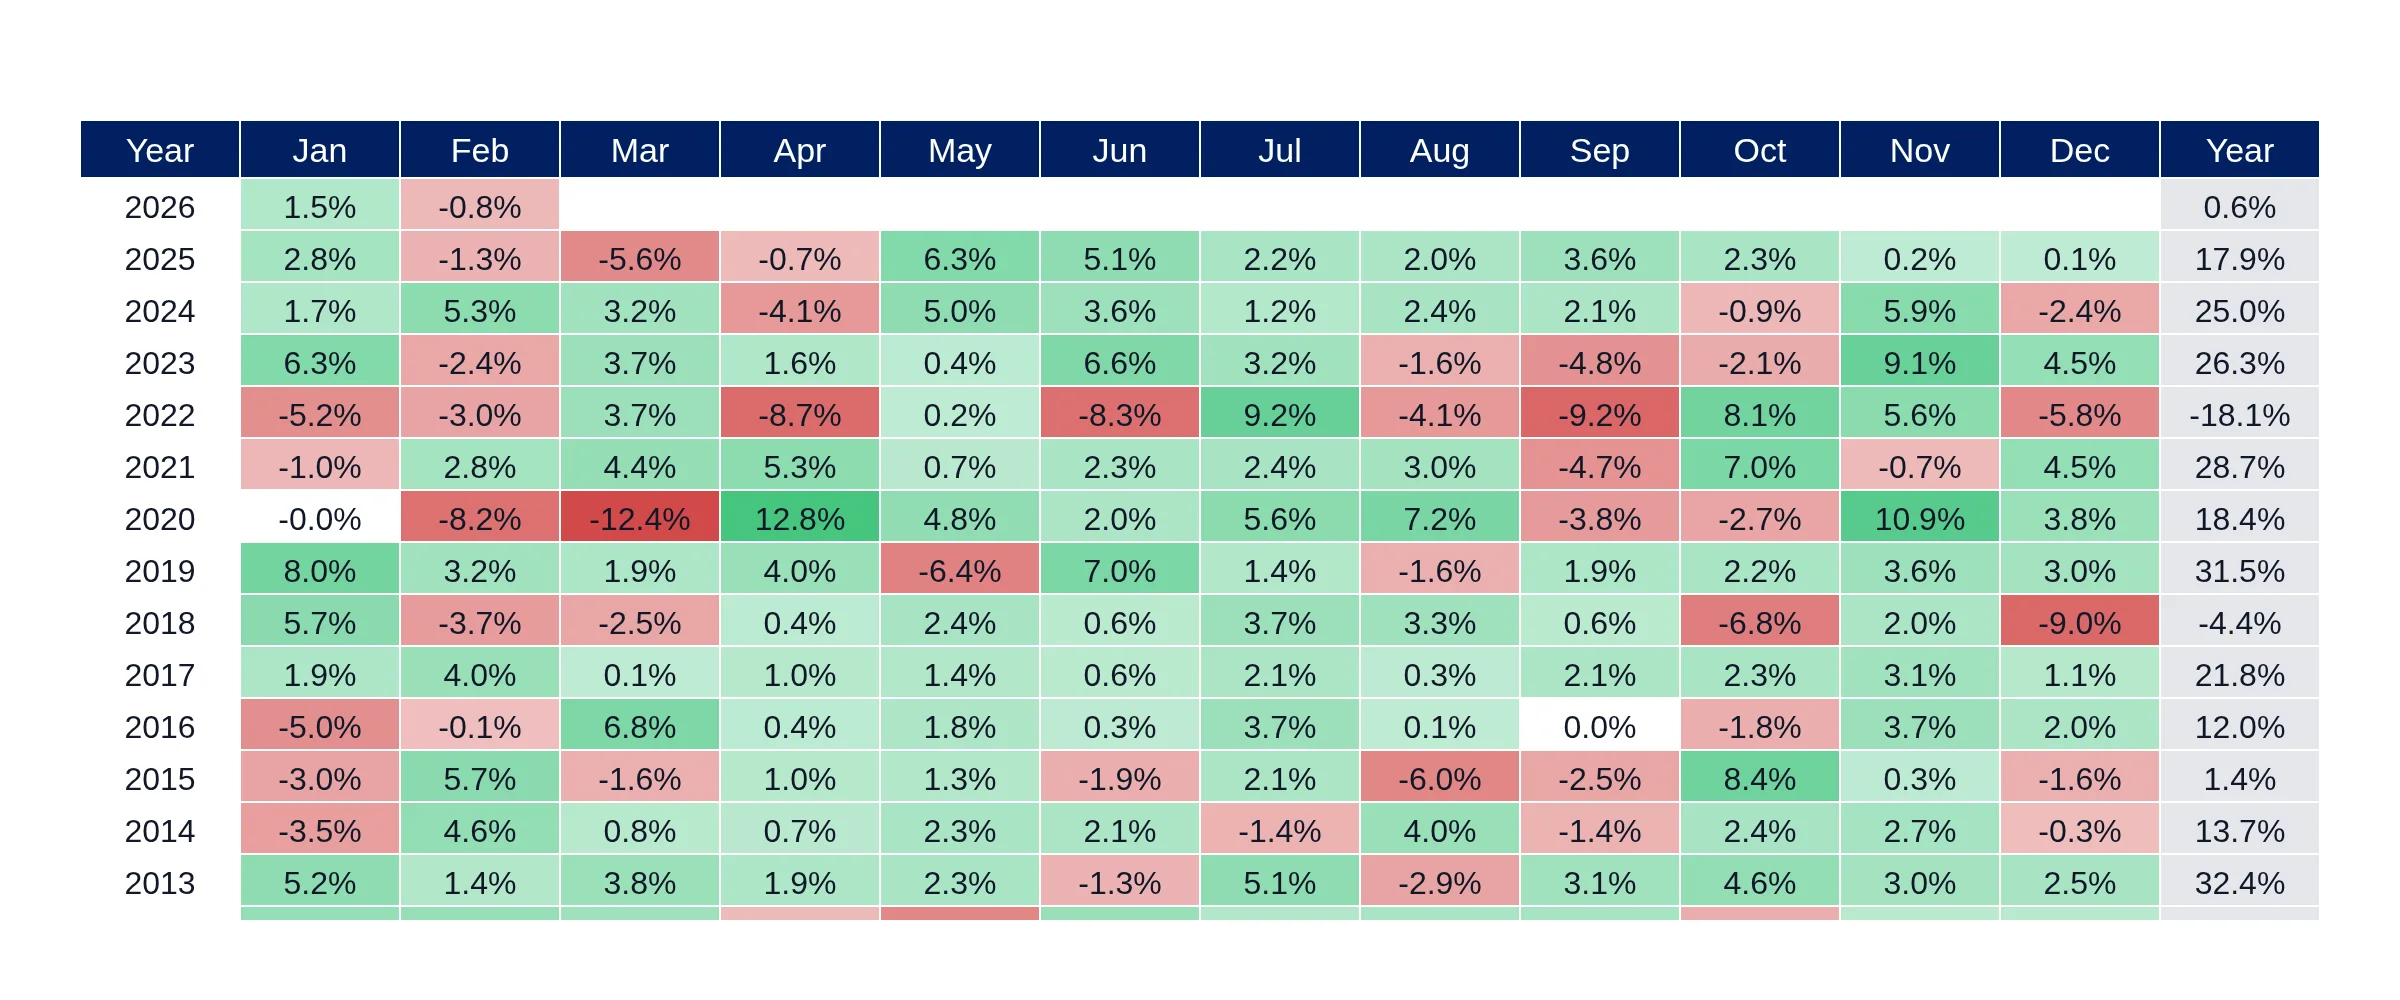
This dashboard tracks essential macro assets including the S&P 500, Nasdaq, DXY, MSCI ACWI, MSCI Emerging Markets, Bitcoin, Gold, and Oil. By comparing these benchmarks, investors can assess performance and risk across various asset classes, enabling informed decision-making.
The data in the Global Assets Tracking dashboard is updated on trading days, ensuring that investors have access to the most current market prices and performance metrics. This regular update frequency allows for timely analysis of market momentum and risk conditions.
This dashboard tracks a global set of macro assets using daily market prices to compare performance and risk across key benchmarks such as the S&P 500, Nasdaq, DXY, MSCI ACWI, MSCI Emerging Markets, Bitcoin, Gold and Oil. It consolidates core metrics like multi-horizon returns, rolling volatility, drawdowns and trend indicators into a single view for cross-asset monitoring. The goal is to quickly identify leaders and laggards, regime shifts and changes in risk conditions across equities, FX, commodities and broader global markets. Data is updated on trading days and presented in a standardized format to make assets comparable across time windows. Use it as a macro “risk dashboard” for allocating, hedging and understanding global market momentum.