Monitor how an equal weighted portfolio of magnificent 7 stocks is performing. Stocks in the portfolio: Apple (AAPL), Amazon (AMZN), Meta (META), Nvidia (NVDA), Google (GOOG), Microsoft (MSFT), Tesla (TSLA).
The Magnificent 7 Portfolio Monitor provides a comparative analysis of the equal-weighted portfolio of top US mega-cap tech stocks against the S&P 500 (SPY). By tracking performance over various time windows, investors can identify leadership periods, concentration risks, and momentum shifts between these two benchmarks.
The Magnificent 7 Portfolio consists of seven major US stocks: Apple (AAPL), Amazon (AMZN), Meta (META), Nvidia (NVDA), Google (GOOG), Microsoft (MSFT), and Tesla (TSLA). This equal-weighted portfolio aims to reflect the performance of leading tech and growth stocks in the US equity market.
The Magnificent 7 Portfolio Monitor includes a dedicated chart for analyzing drawdowns, which helps investors assess periods of significant decline in portfolio value. By utilizing interactive time windows, users can examine historical drawdowns, recoveries, and shifts in market regimes, enhancing their understanding of risk management in US mega-cap stocks.
This dashboard tracks the Magnificent 7 portfolio by building an equal-weighted basket of the top US mega-cap tech and growth stocks (AAPL, AMZN, META, NVDA, GOOGL/GOOG, MSFT and TSLA). Portfolio returns are computed from daily price data and the basket is rebalanced to equal weights to provide a simple, rules-based view of Magnificent 7 performance. The chart compares the Magnificent 7 portfolio versus the S&P 500 (SPY) to highlight periods of leadership, concentration risk and momentum shifts. Interactive time windows (1Y, 3Y, 5Y, 10Y, 20Y and full history) help analyze drawdowns, recoveries and regime changes. Use it to monitor US mega-cap leadership and understand how the Magnificent 7 is driving broader US equity market performance.
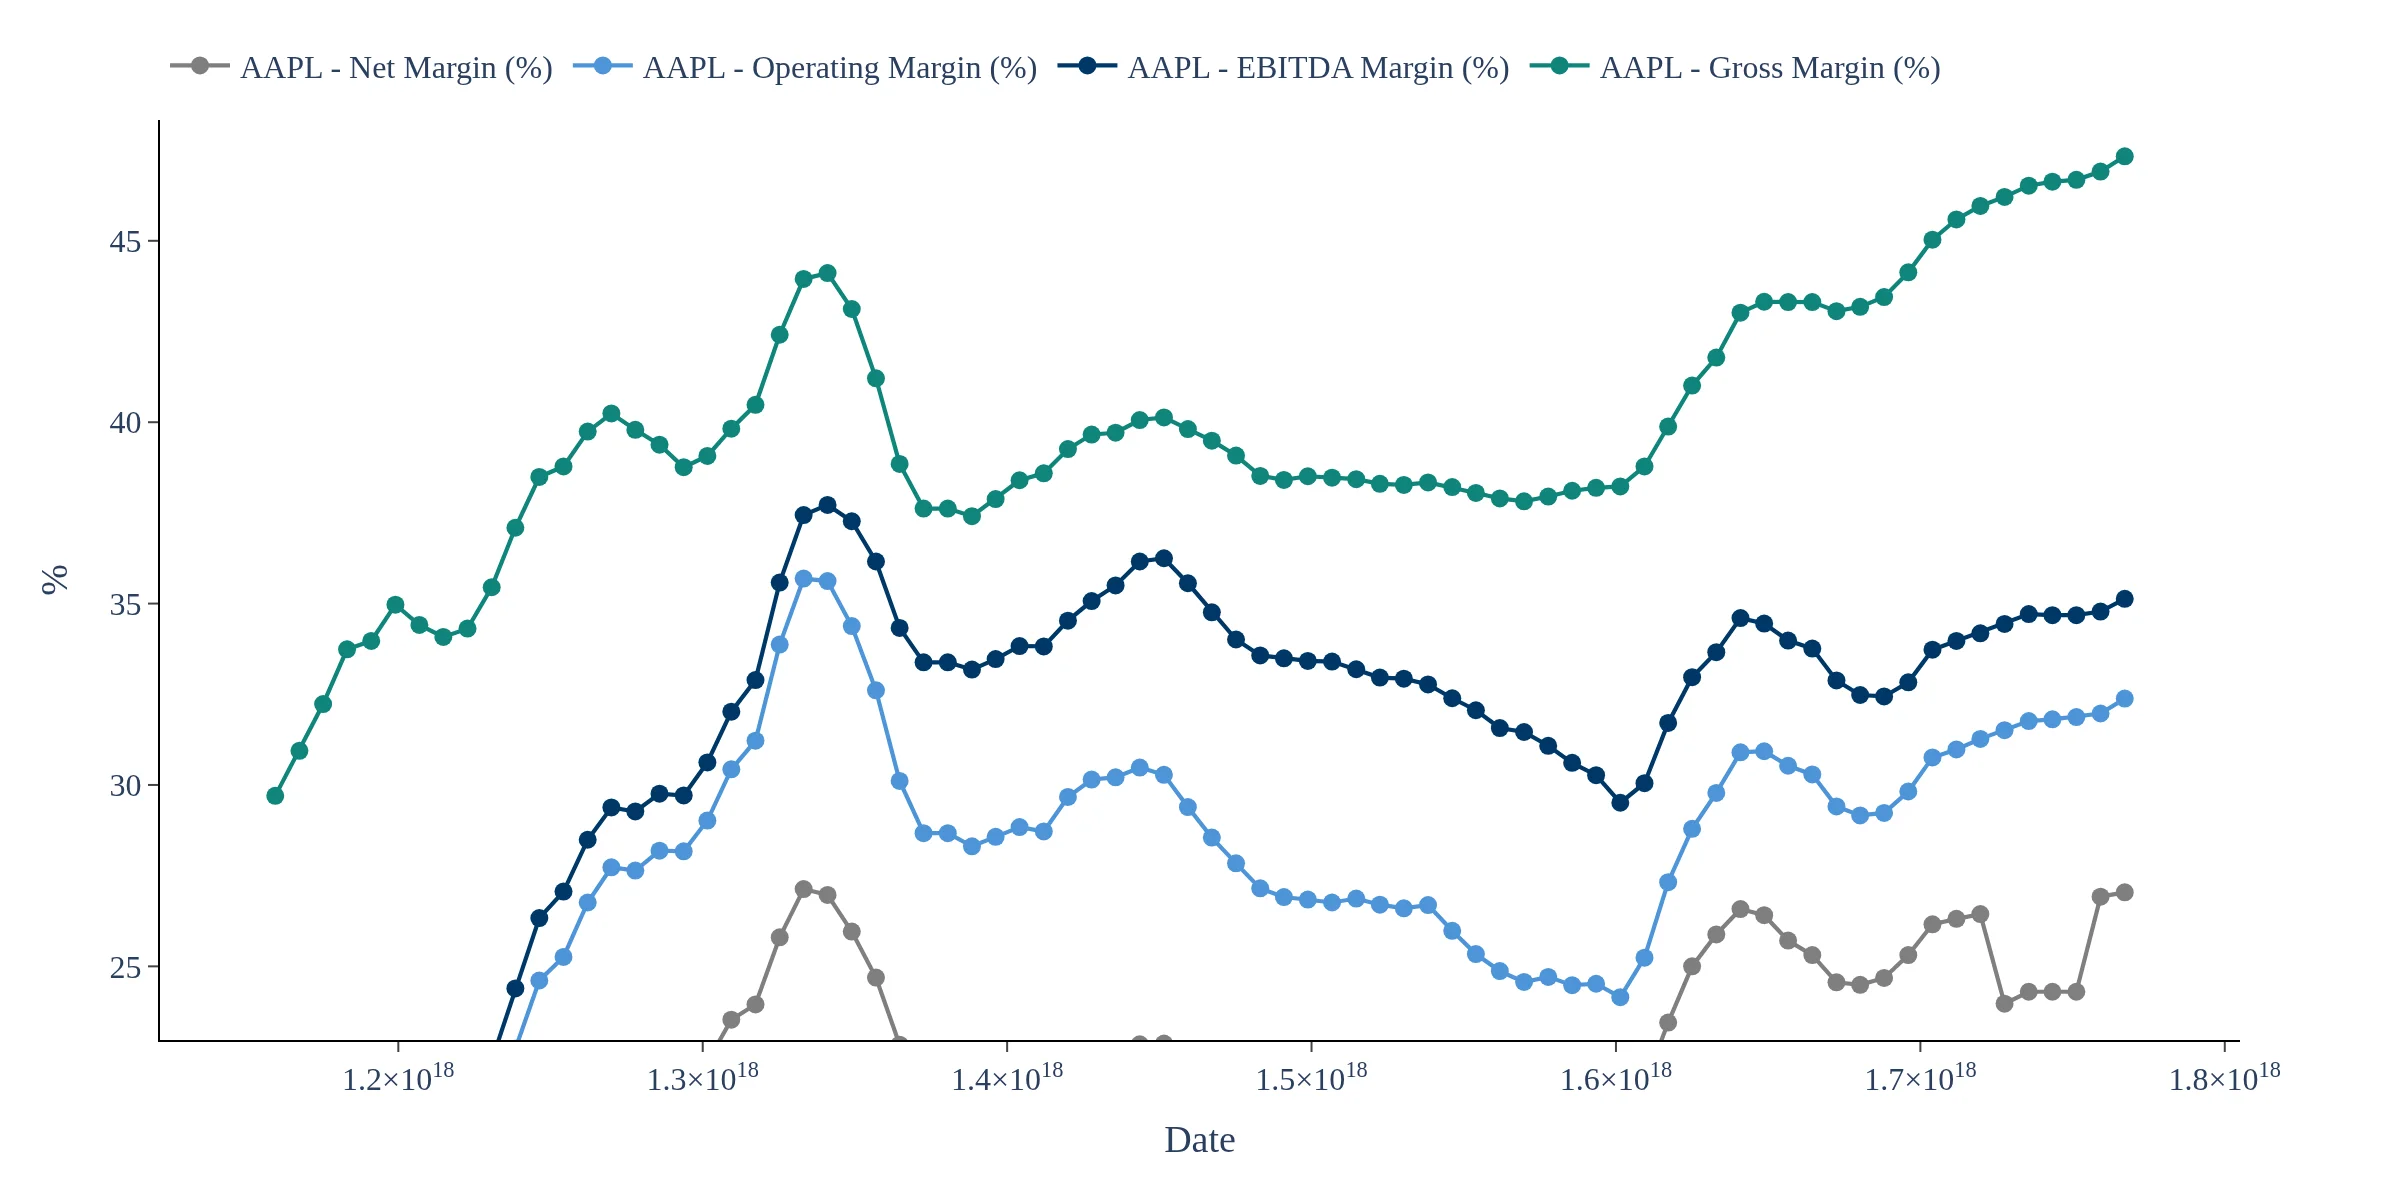
Track key financial statement measures for the magnificent seven companies
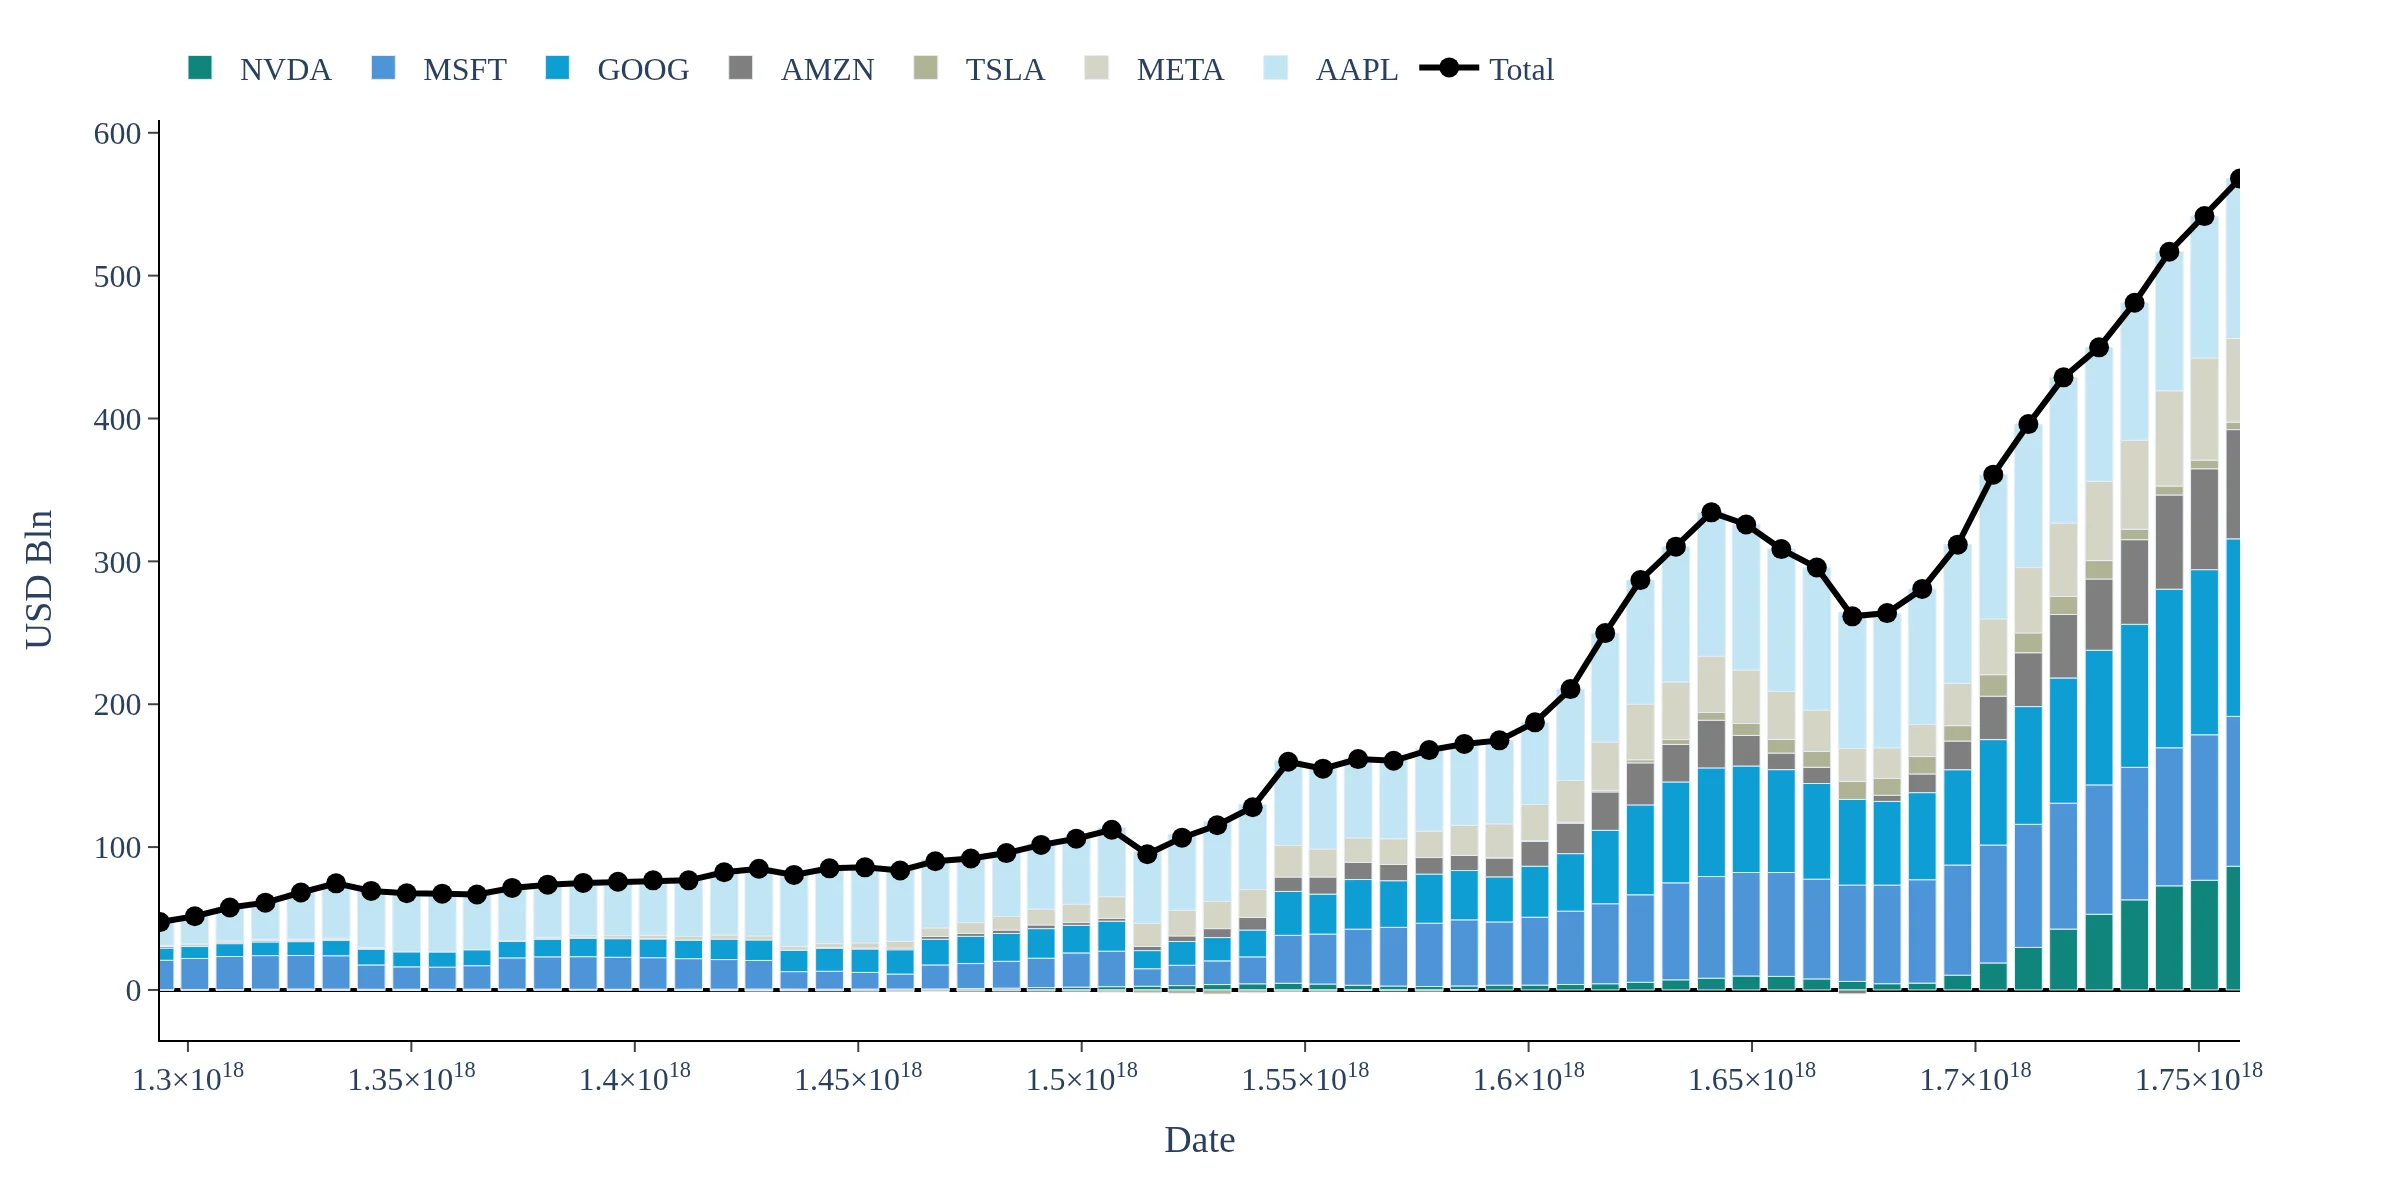
Track the main aggregate financial statement measures for the magnificent seven companies
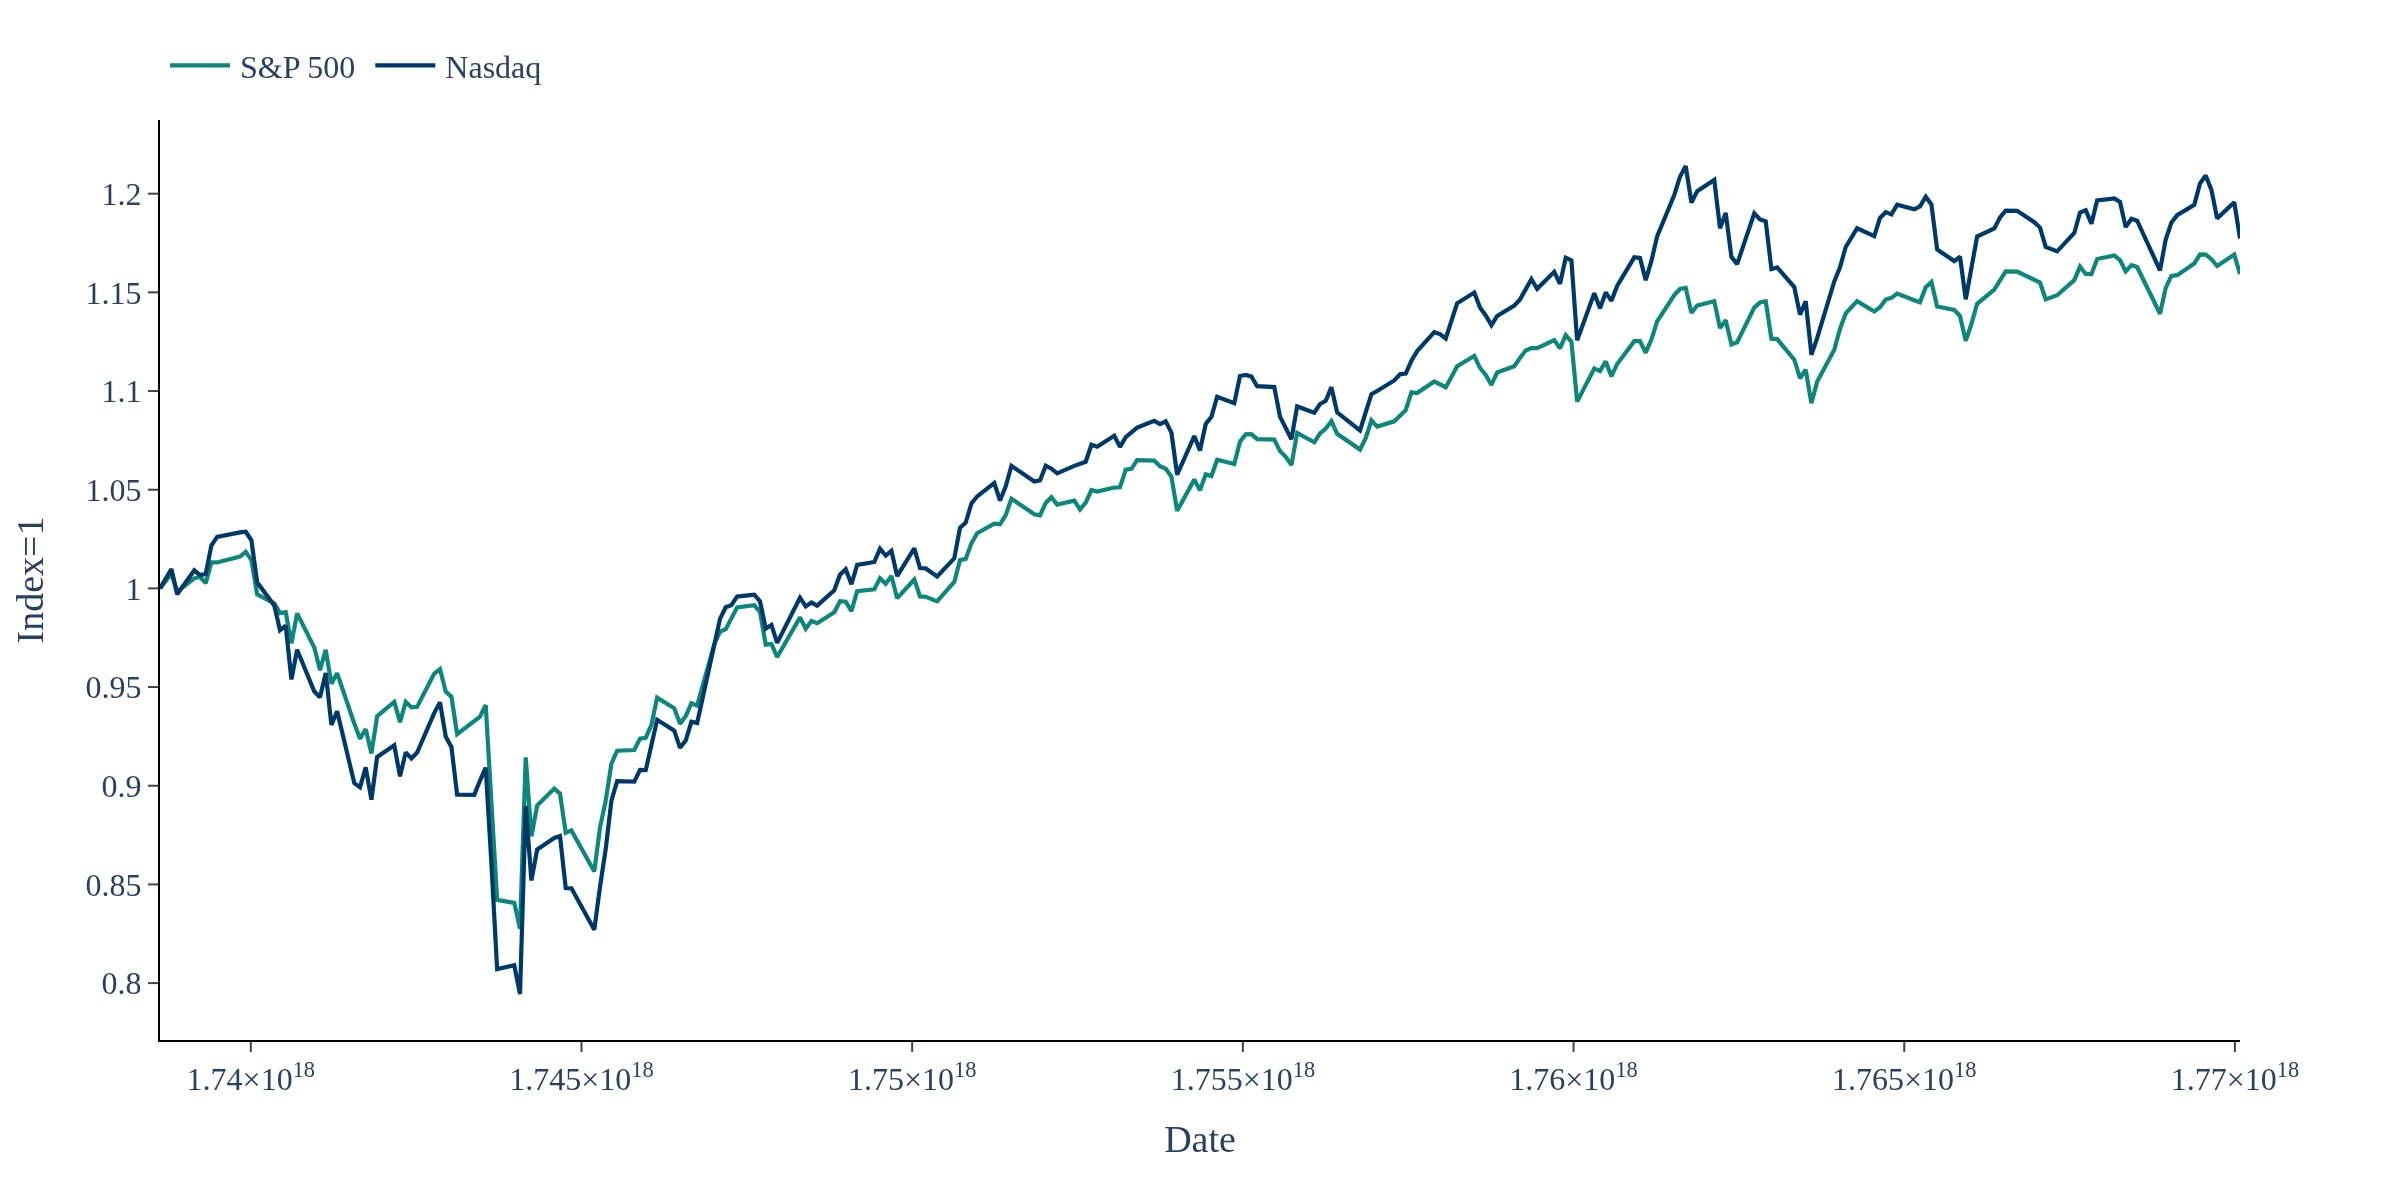
Track how are US Equities are behaving