Monitor the main aggregate financial statements measures of the magnificent 7 stocks: AAPL, AMZN, GOOG, META, TSLA, NVDA, MSFT
You can monitor the financial performance of the Magnificent 7 stocks—AAPL, AMZN, GOOGL, META, MSFT, NVDA, and TSLA—using the Total Magnificent 7 Stocks Financials Screener. This dashboard aggregates key financial metrics such as revenue, operating income, and net income, allowing you to analyze their performance both quarterly and on a trailing 4-quarter basis.
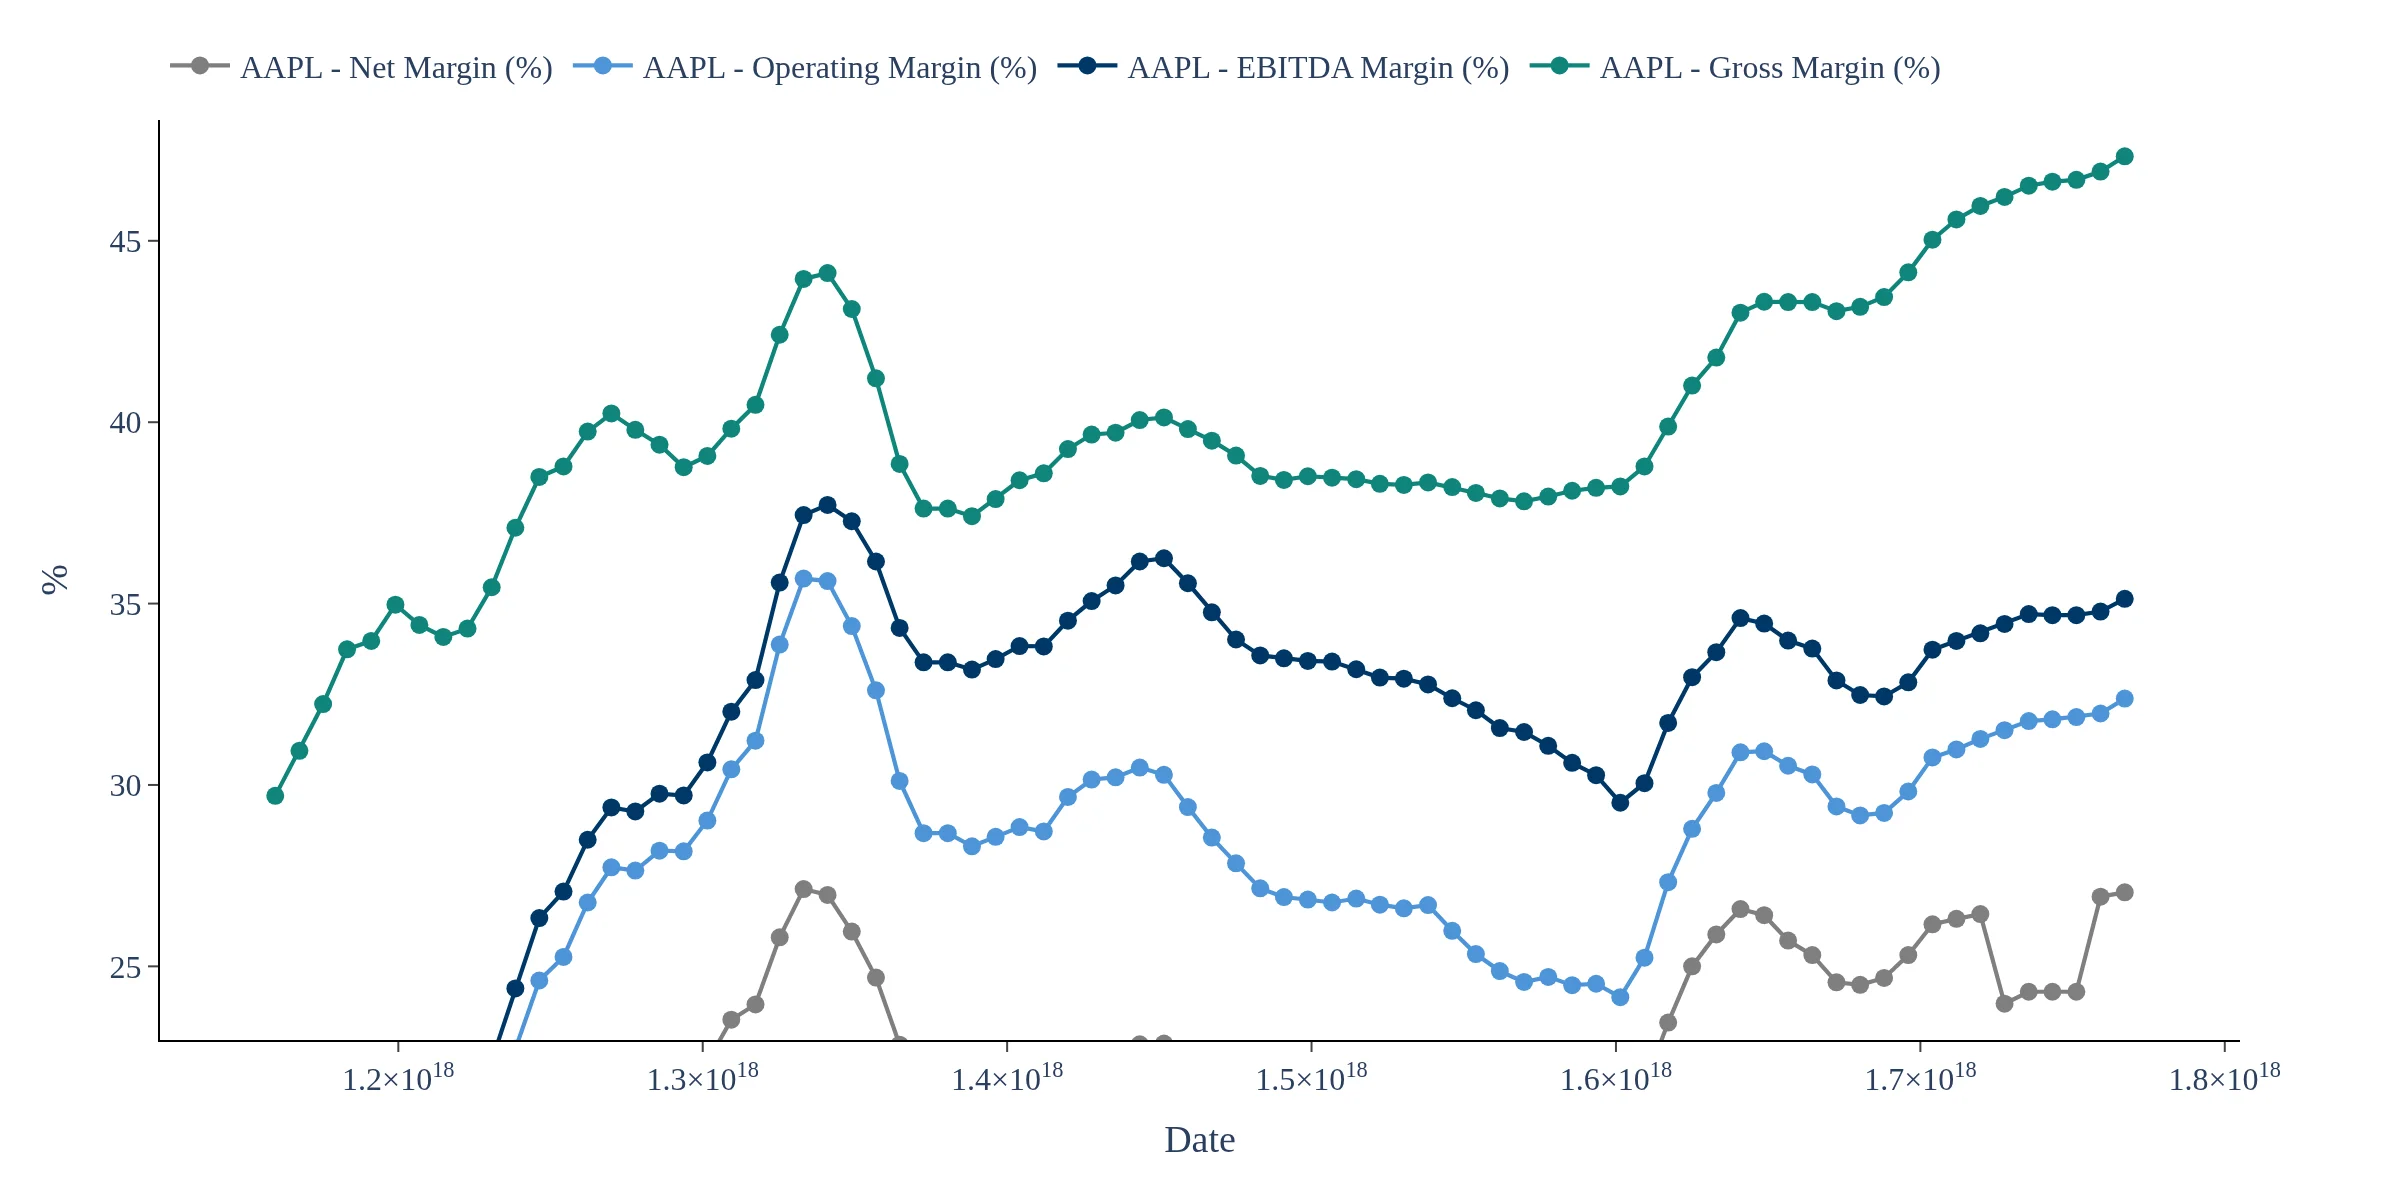
The Total Magnificent 7 Financials Screener includes essential income statement metrics like trailing 4-quarter revenue, operating income, EBITDA, net income, and total margins. These metrics help investors assess profitability and growth trends among the Magnificent 7 stocks.
The dashboard utilizes charts to visualize the trailing 4-quarter financial metrics of the Magnificent 7 stocks, highlighting each company's contribution to the total and showcasing growth cycles and earnings momentum. This visual representation aids in comparing the fundamentals of Big Tech over time.
This dashboard aggregates the financial statements of the Magnificent 7 (AAPL, AMZN, GOOGL, META, MSFT, NVDA, TSLA) into a single, easy-to-read fundamentals monitor. We track key income statement metrics like revenue, operating income, net income and profitability margins, both quarterly and on a trailing 4-quarter (TTM) basis. Charts show each company’s contribution and the group total to highlight concentration, growth cycles, and earnings momentum. Use it to compare Big Tech fundamentals over time and follow the core drivers behind the Magnificent 7’s market impact.
Track key financial statement measures for the magnificent seven companies
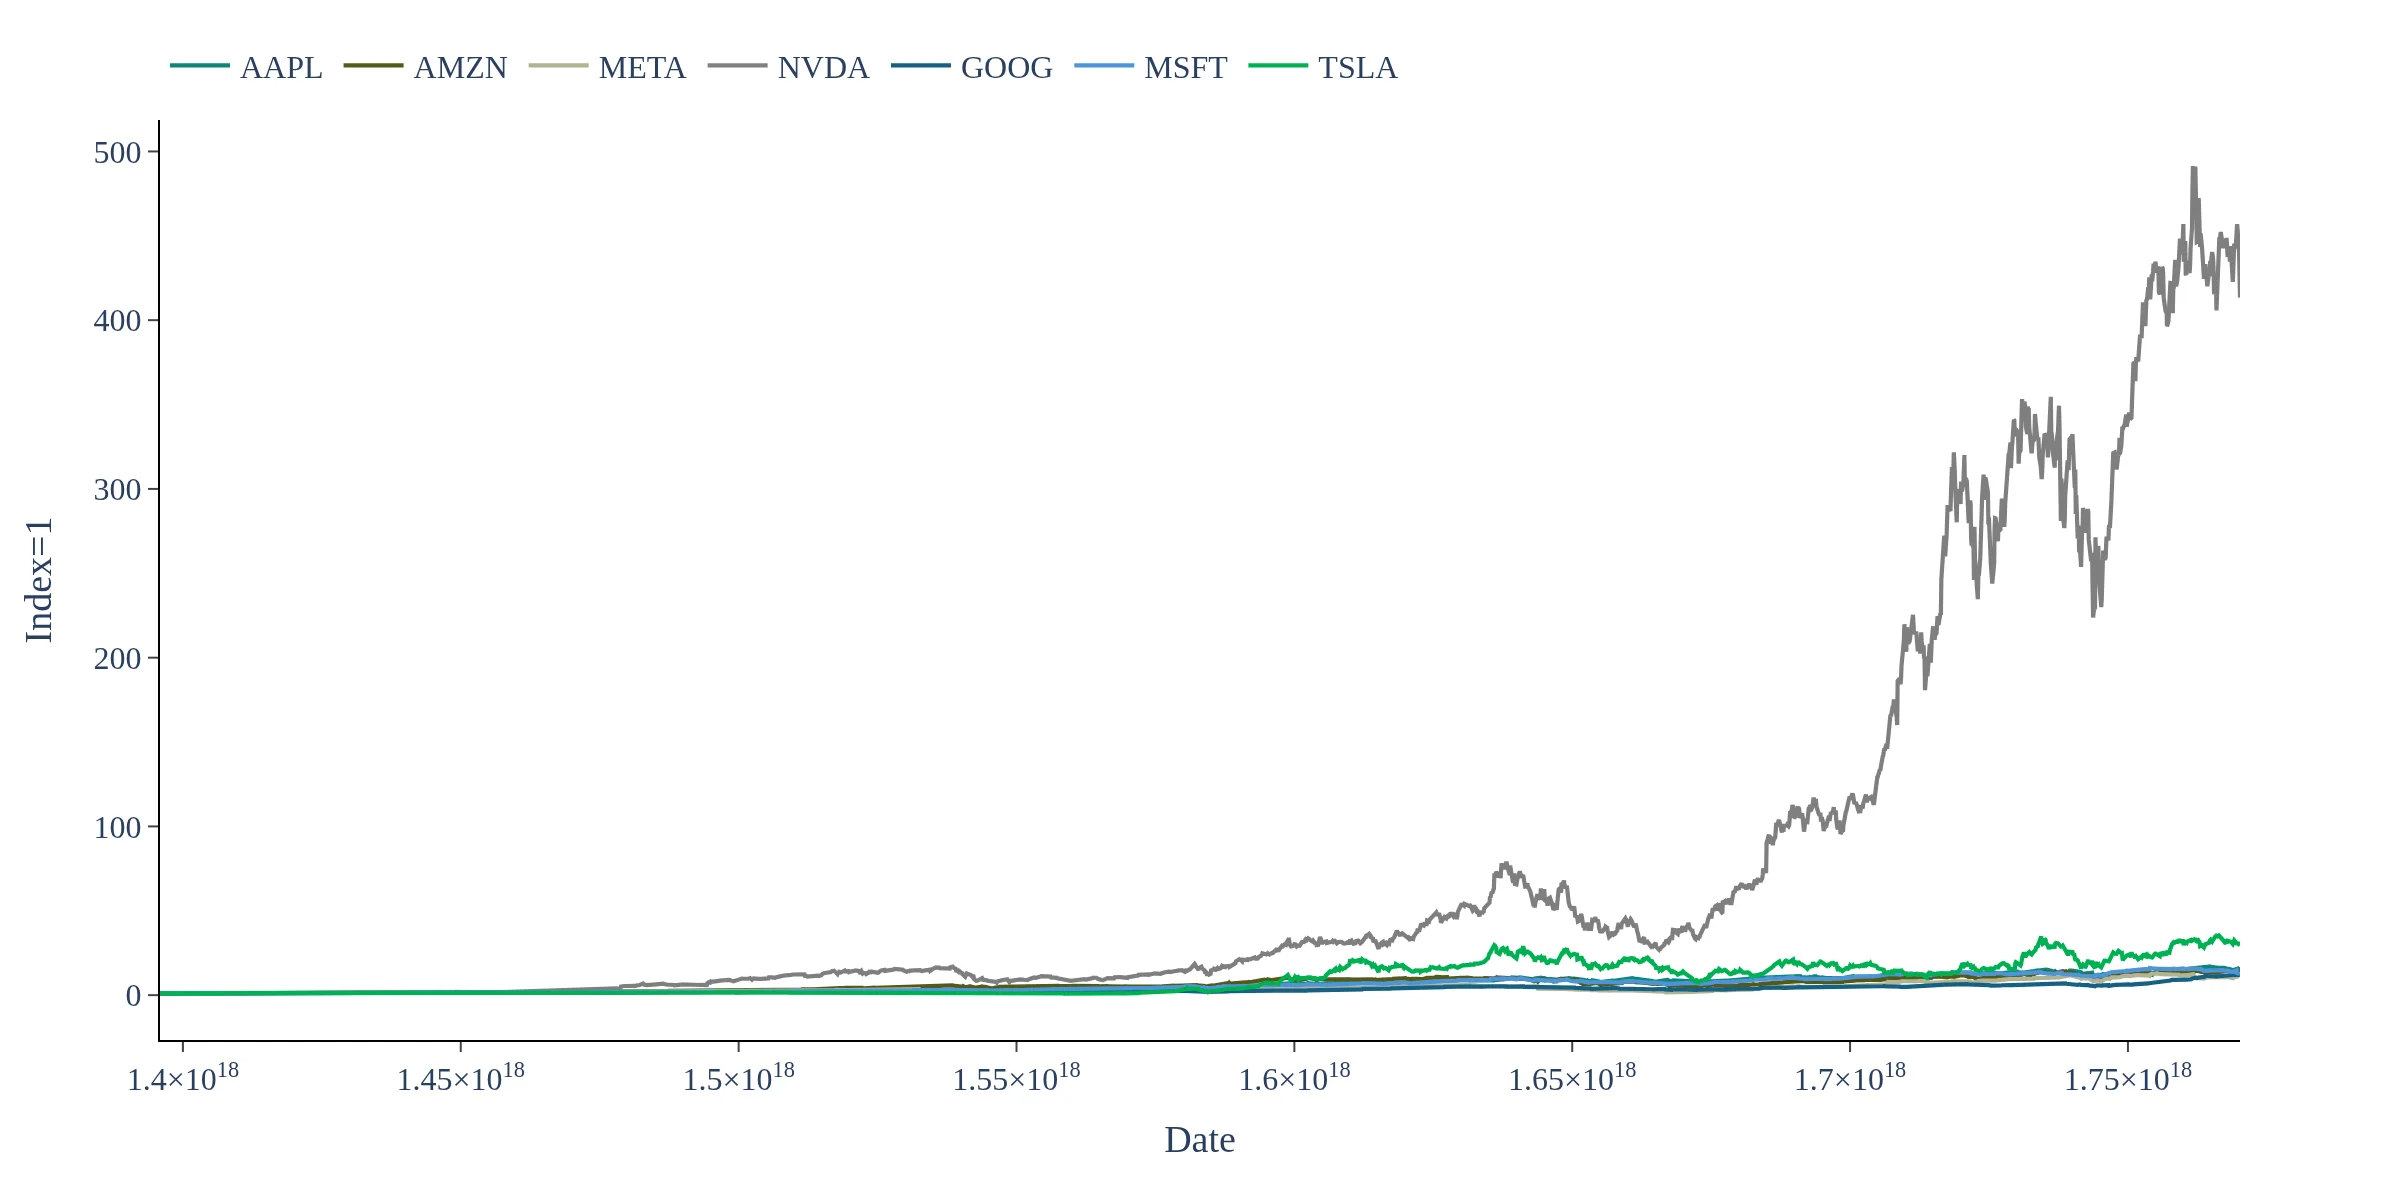
Track how the Magnificent 7 stocks are performing inside an equal weighted portfolio, daily rebalanced
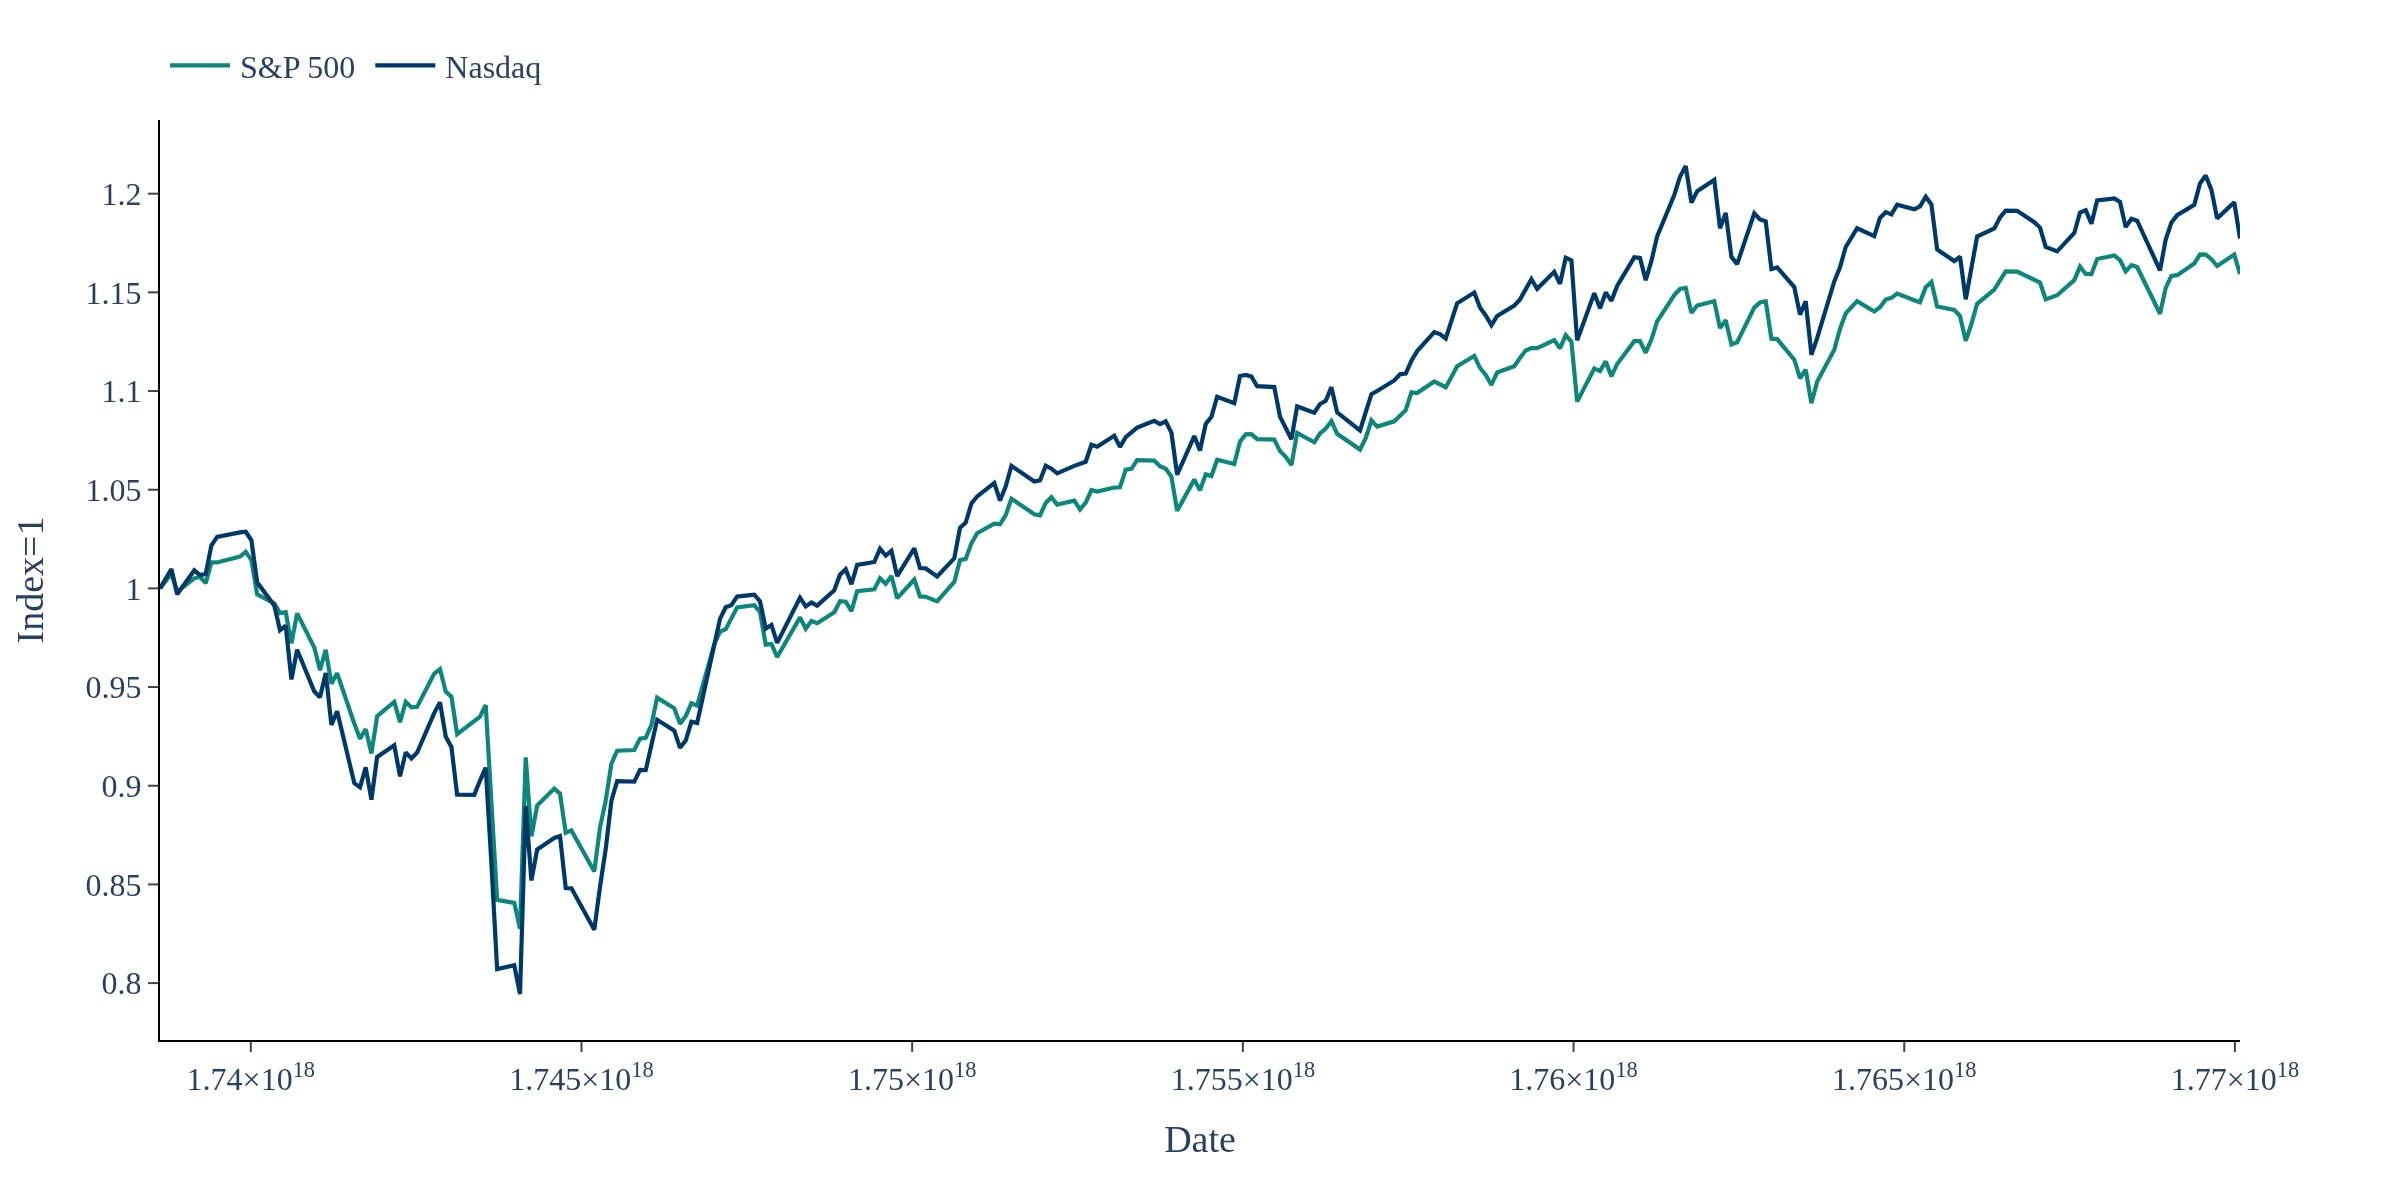
Track how are US Equities are behaving