Quick insight consolidating S&P 500 performance across all years since 1984.
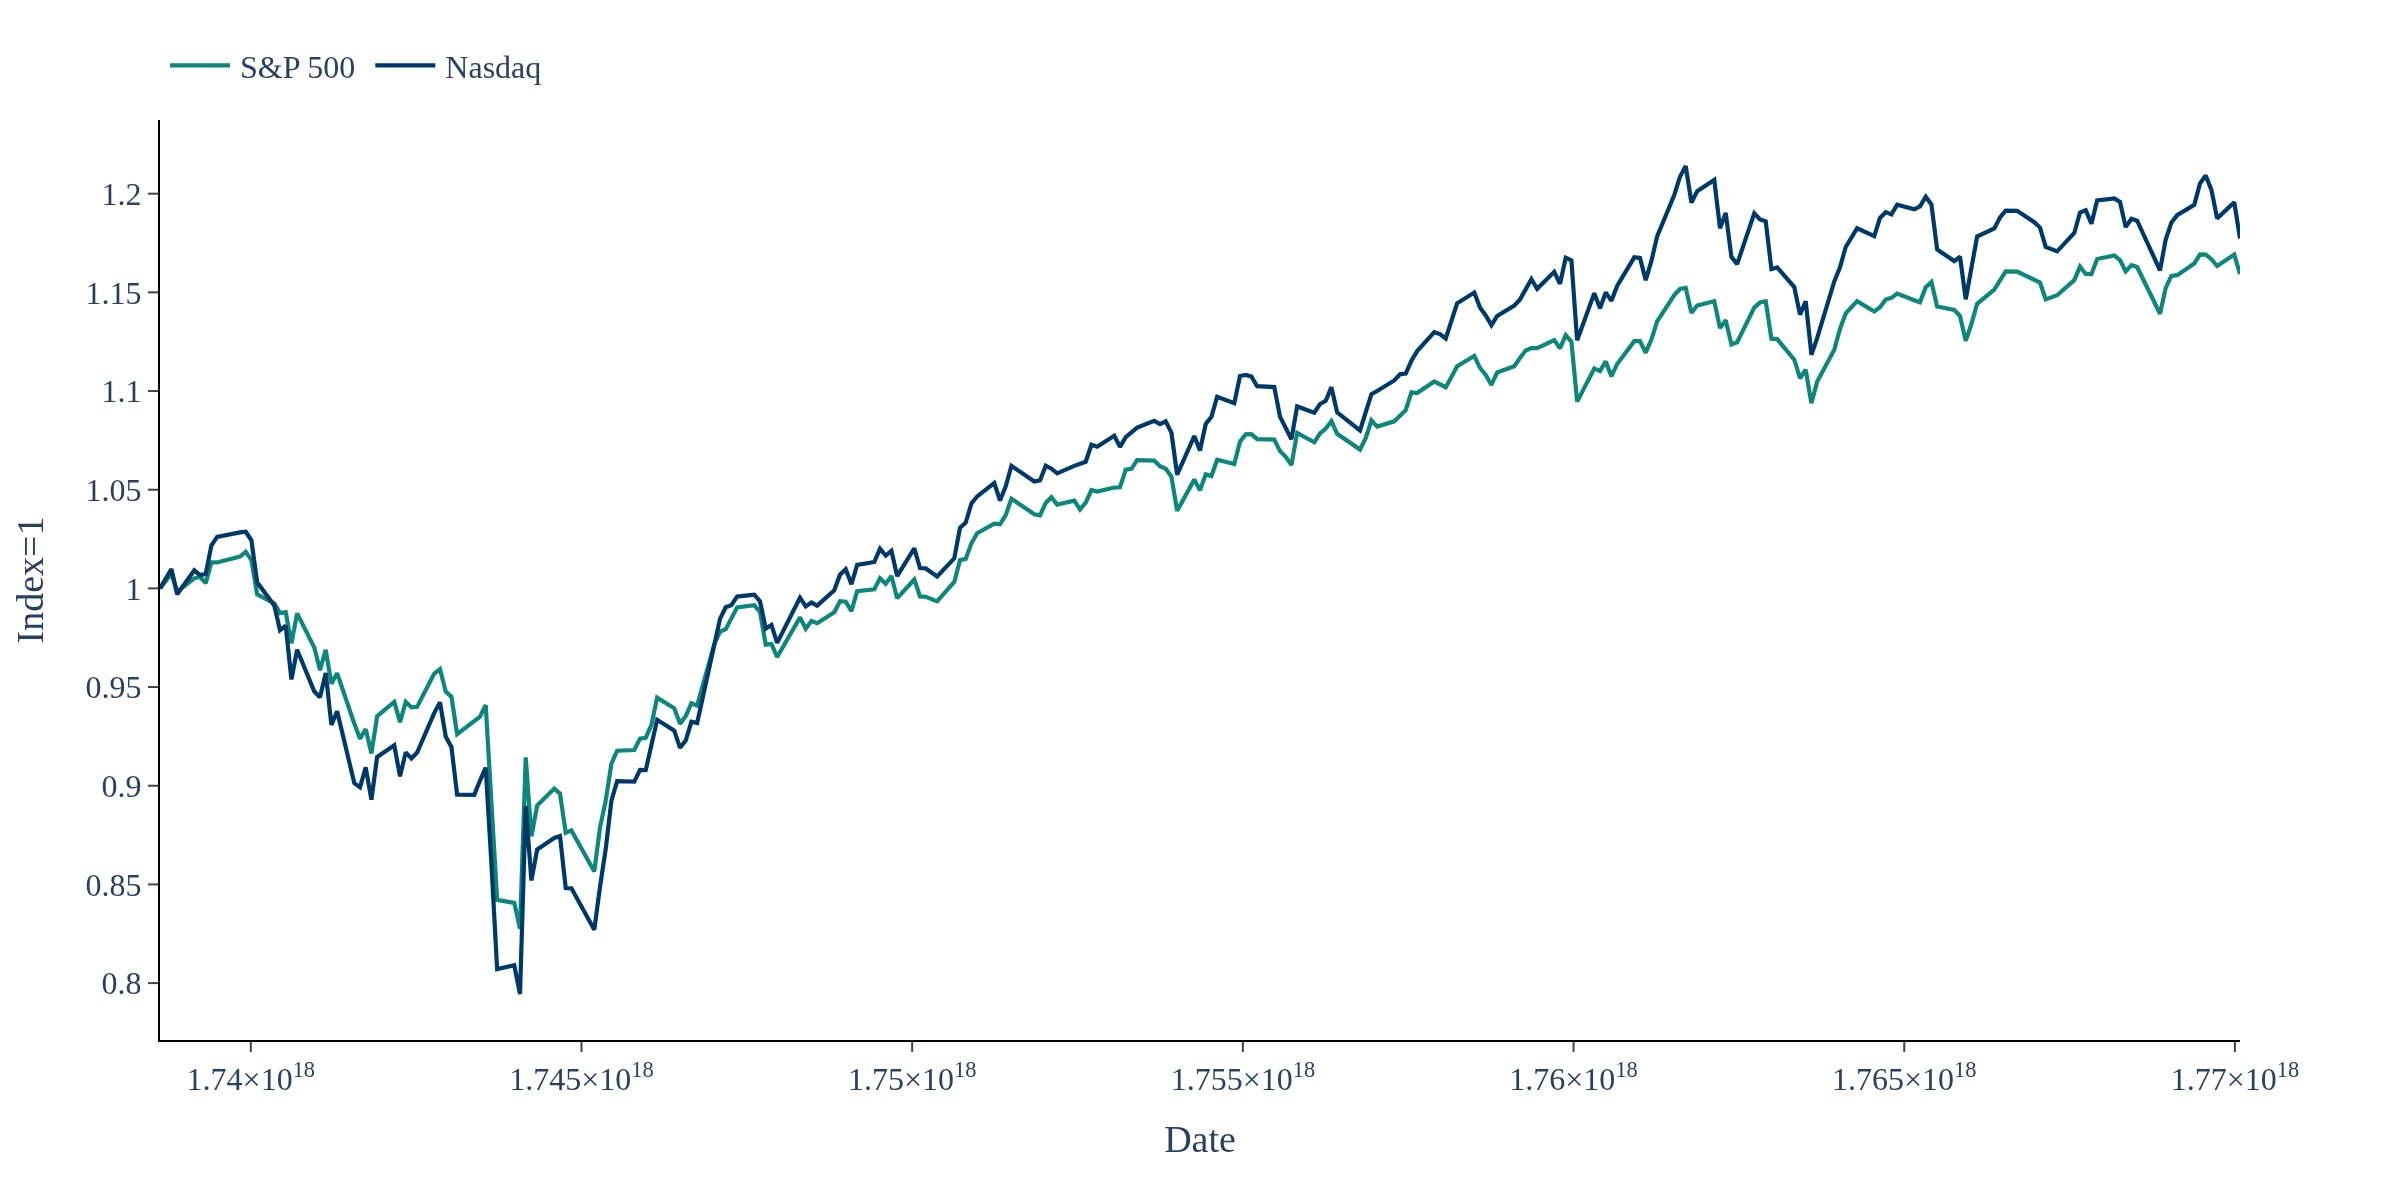
The S&P 500 Throughout All Years dashboard allows you to compare the cumulative performance of the S&P 500 across different calendar years since 1984. By normalizing each year's index level to 1.0, you can easily identify patterns in volatility, drawdowns, and recovery speed, helping you make informed investment decisions based on historical data.
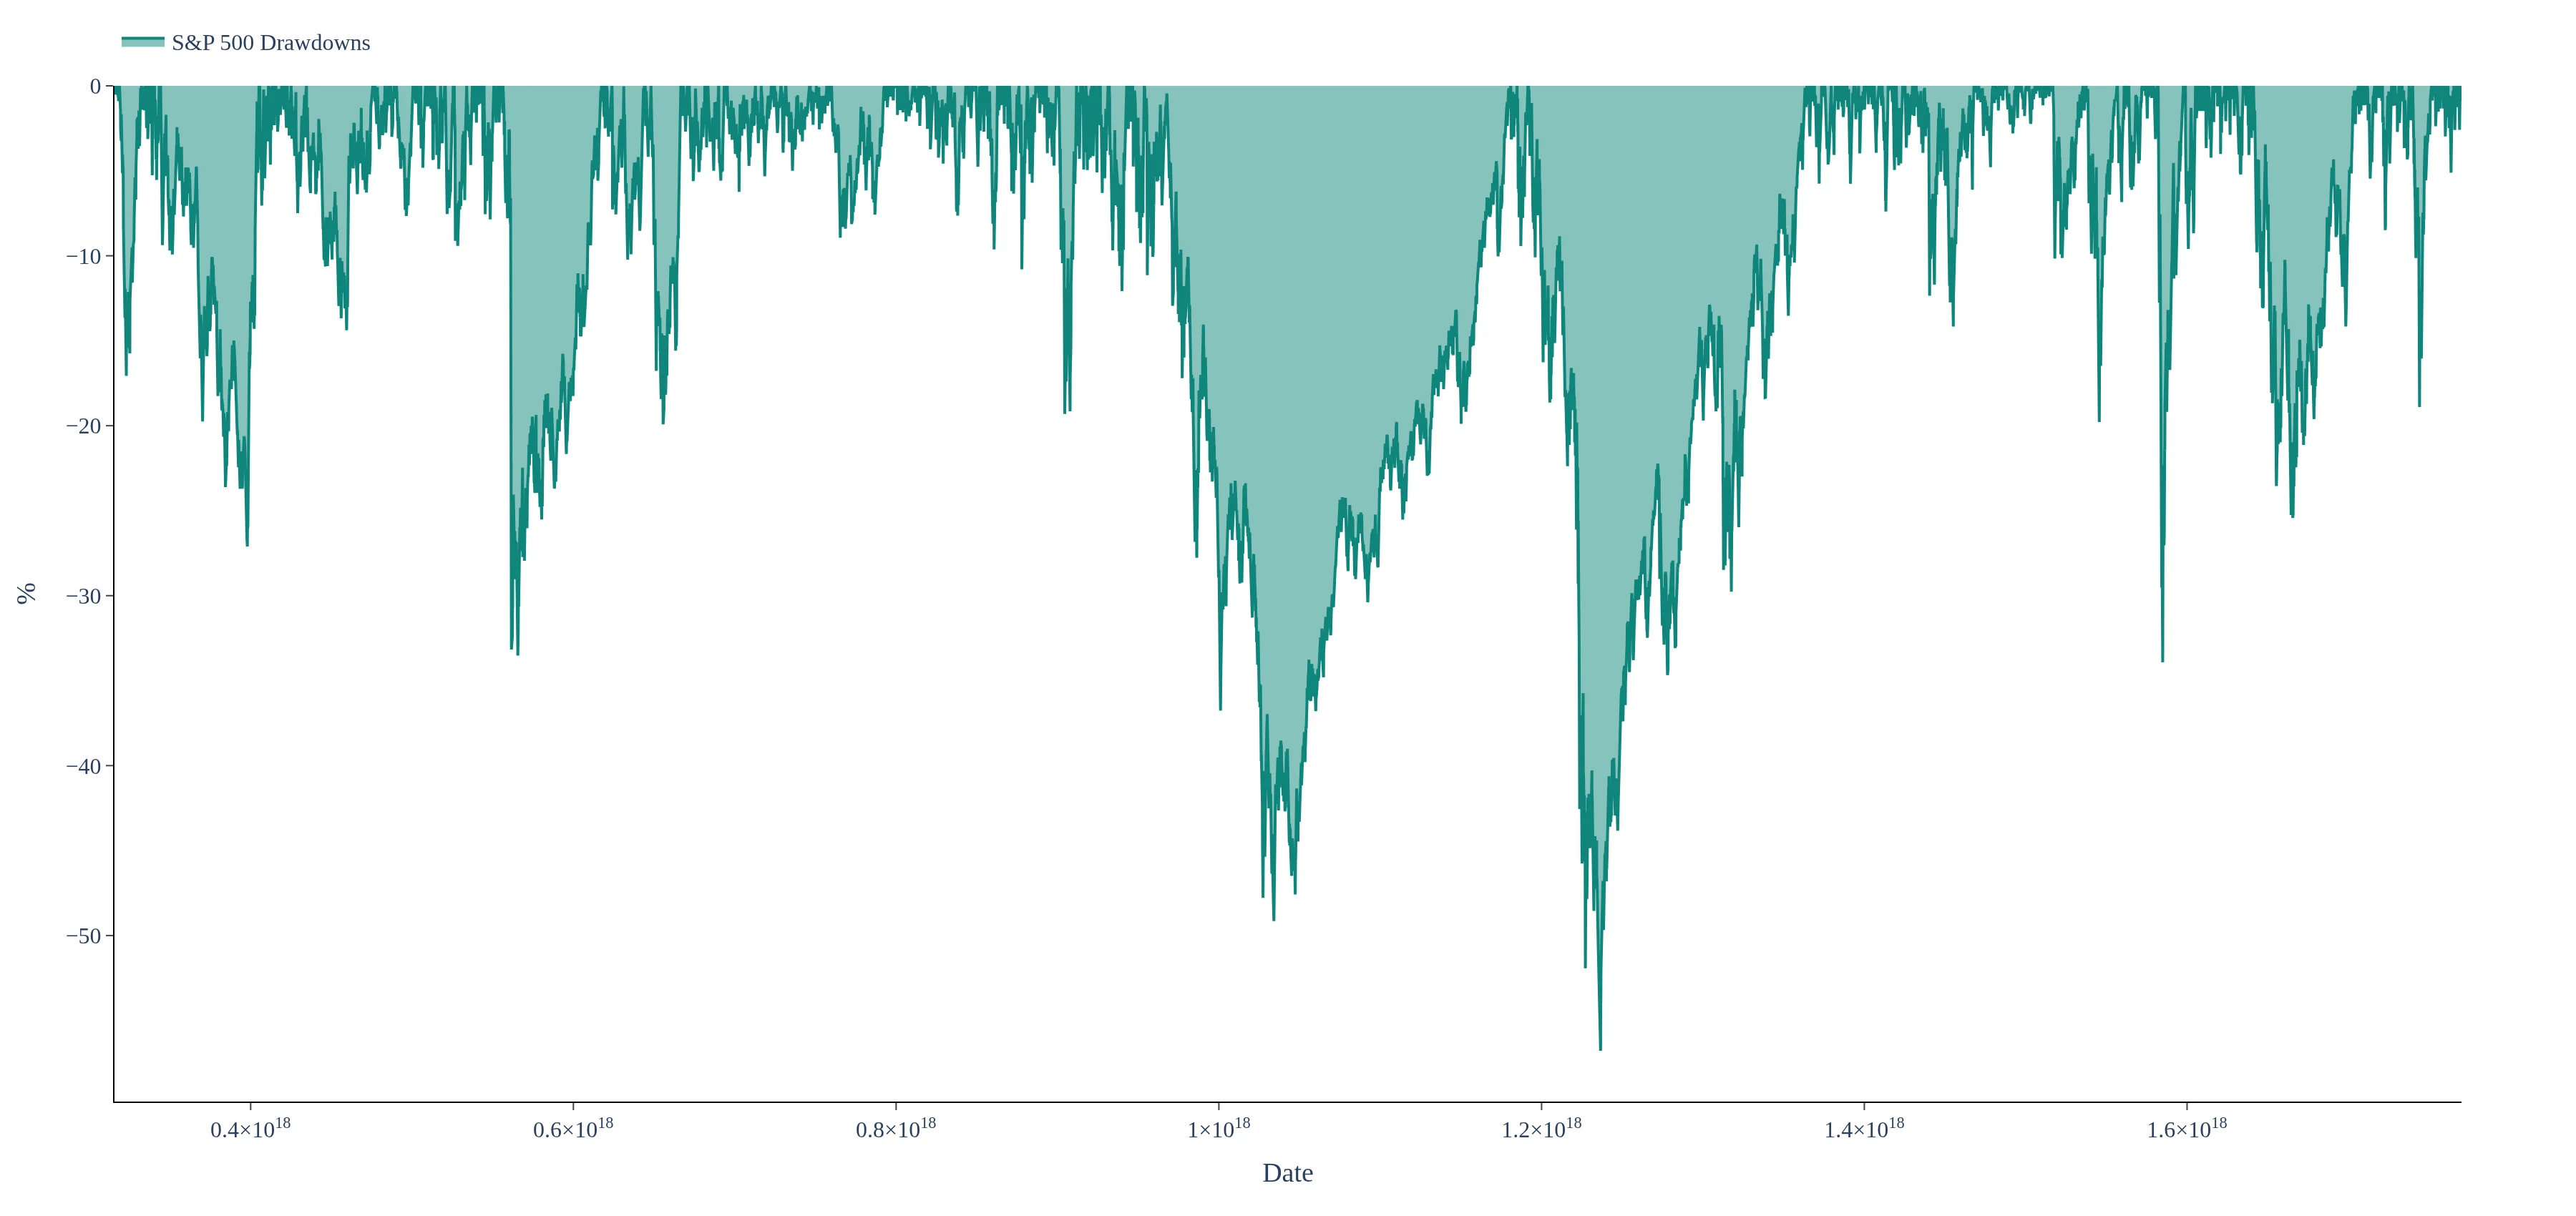
This dashboard provides a comprehensive view of the S&P 500's yearly returns, showing both gains and drawdowns over time. By examining the cumulative paths for each year, investors can benchmark current performance against historical trends and assess the timing of market recoveries.
The S&P 500 Throughout All Years dashboard is updated on trading days, reflecting the latest daily closing prices. This ensures that users have access to the most current performance metrics, allowing for timely analysis of year-to-date behavior in the equity market.
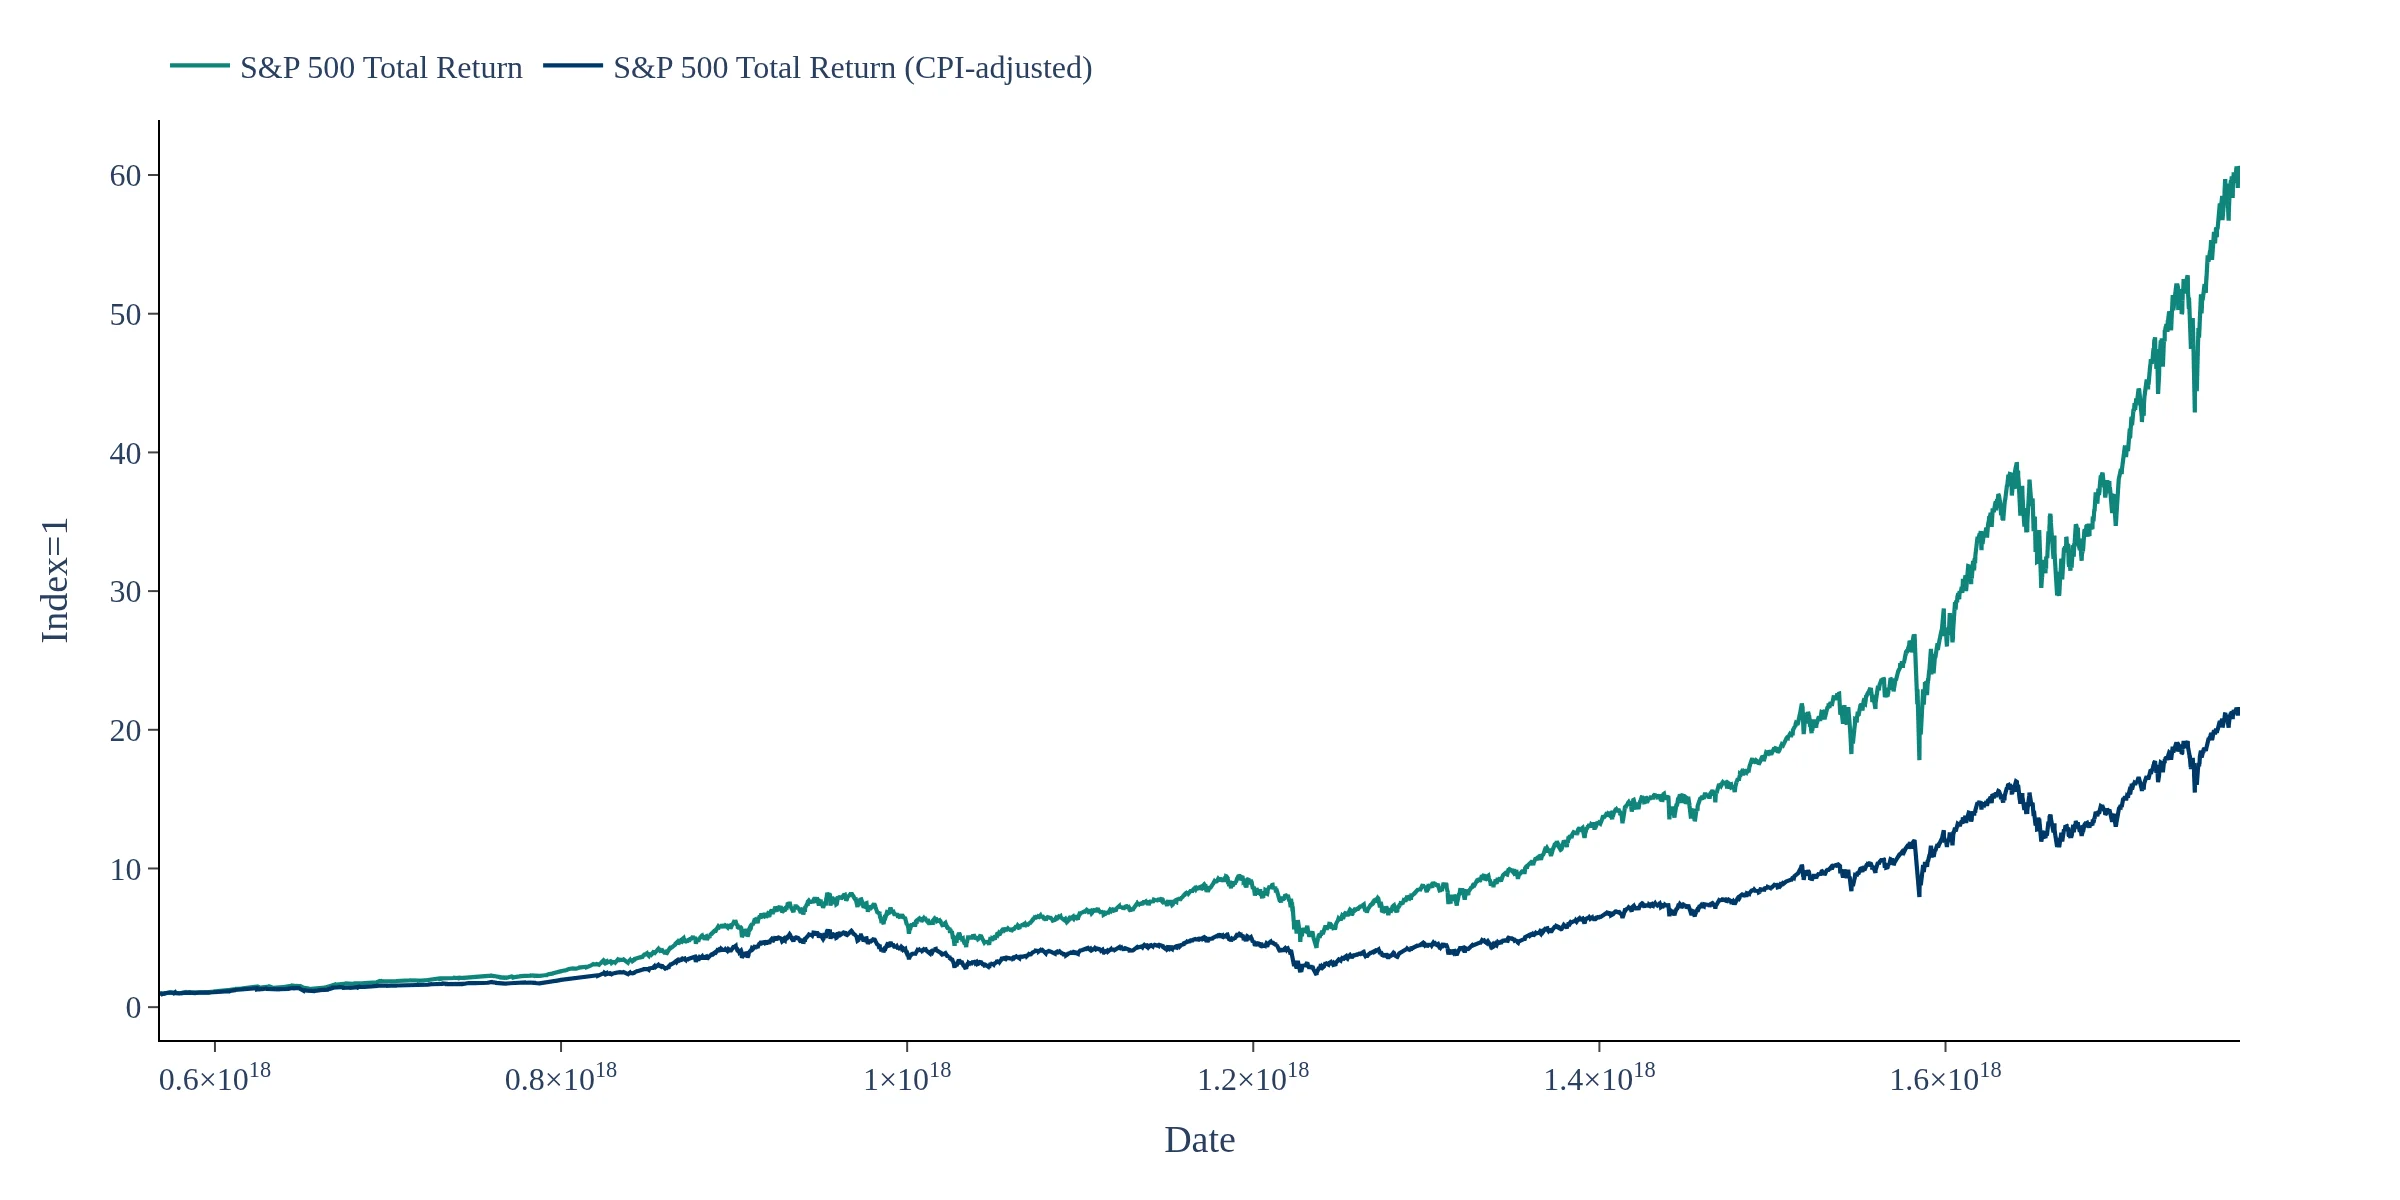
This dashboard compares S&P 500 performance across calendar years by normalizing each year’s index level to 1.0 at the start of the year. Each chart shows the cumulative path through that year, making it easy to compare the magnitude and timing of gains and drawdowns across market cycles. The series is built from daily closing prices and updated on trading days, with the latest value labeled for quick reference. Use it to benchmark the current year versus past years and to identify common patterns in volatility, drawdowns and recovery speed. Results are shown in nominal terms and focus on year-to-date behavior.