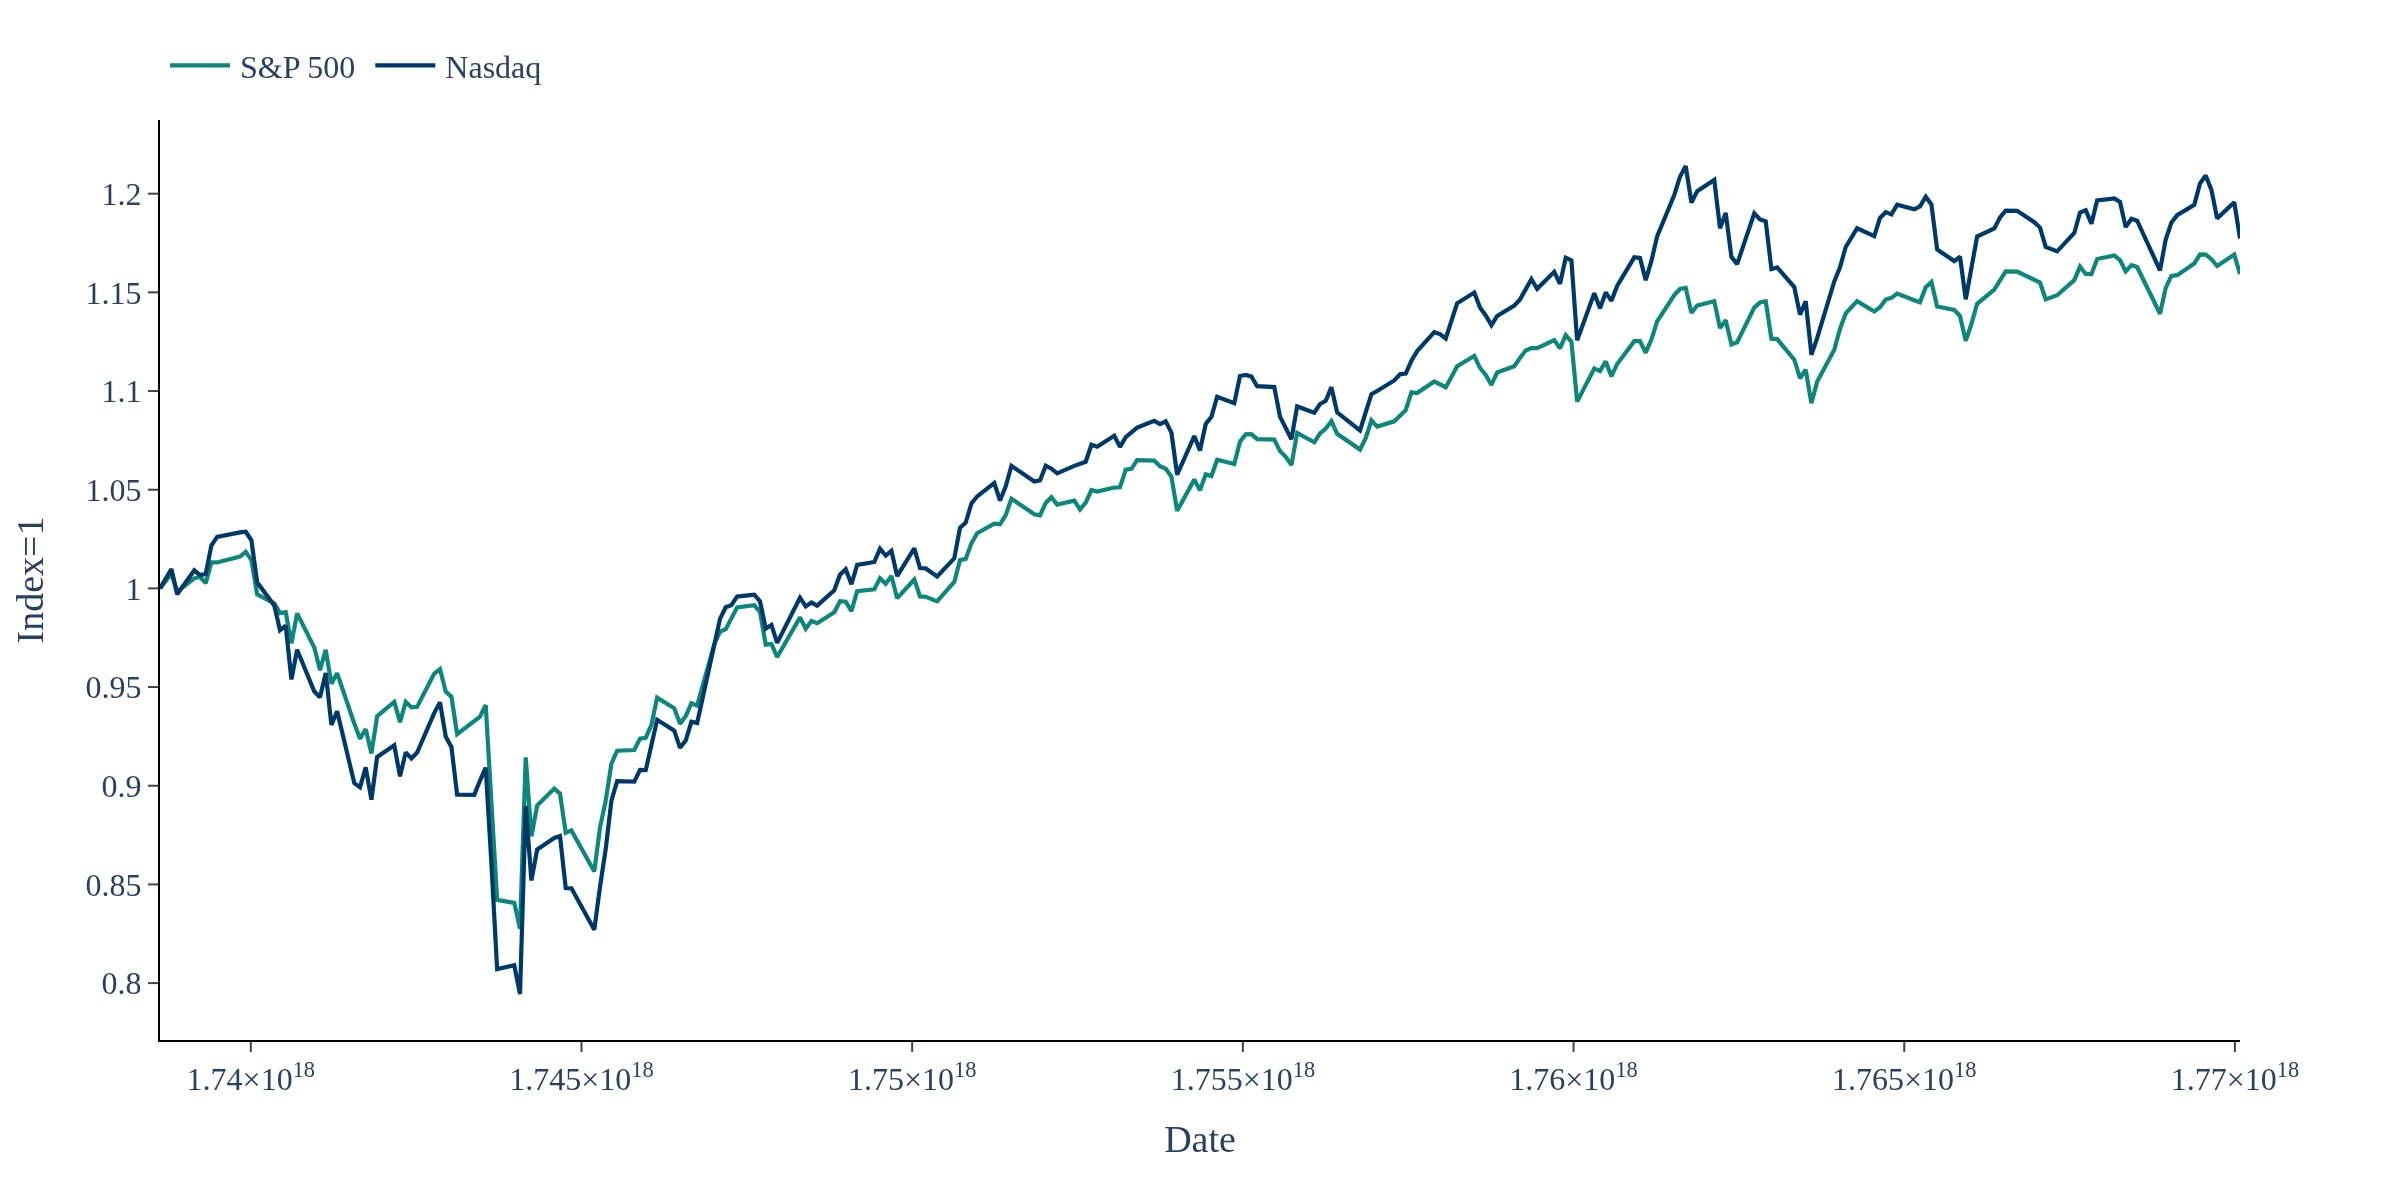
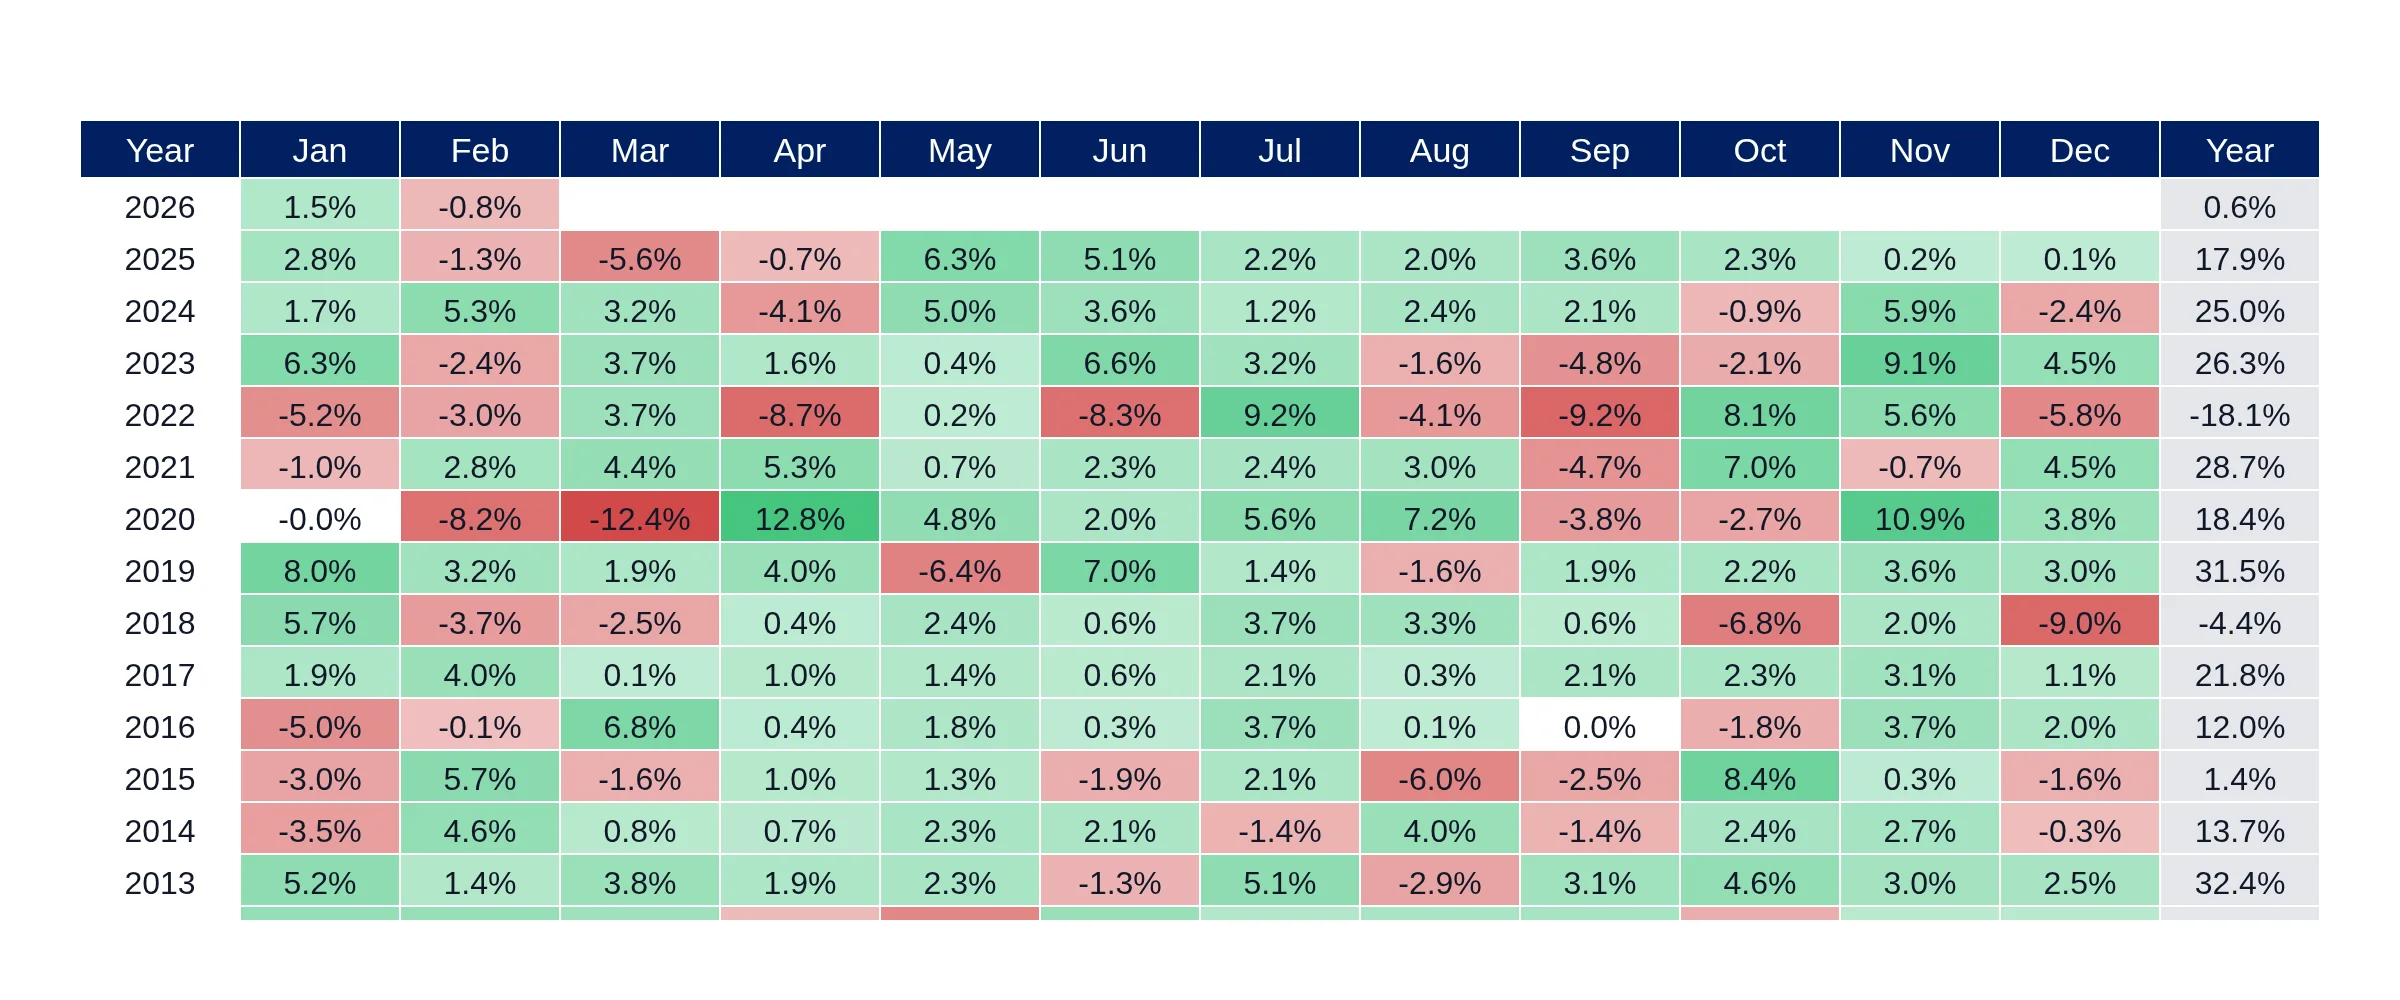
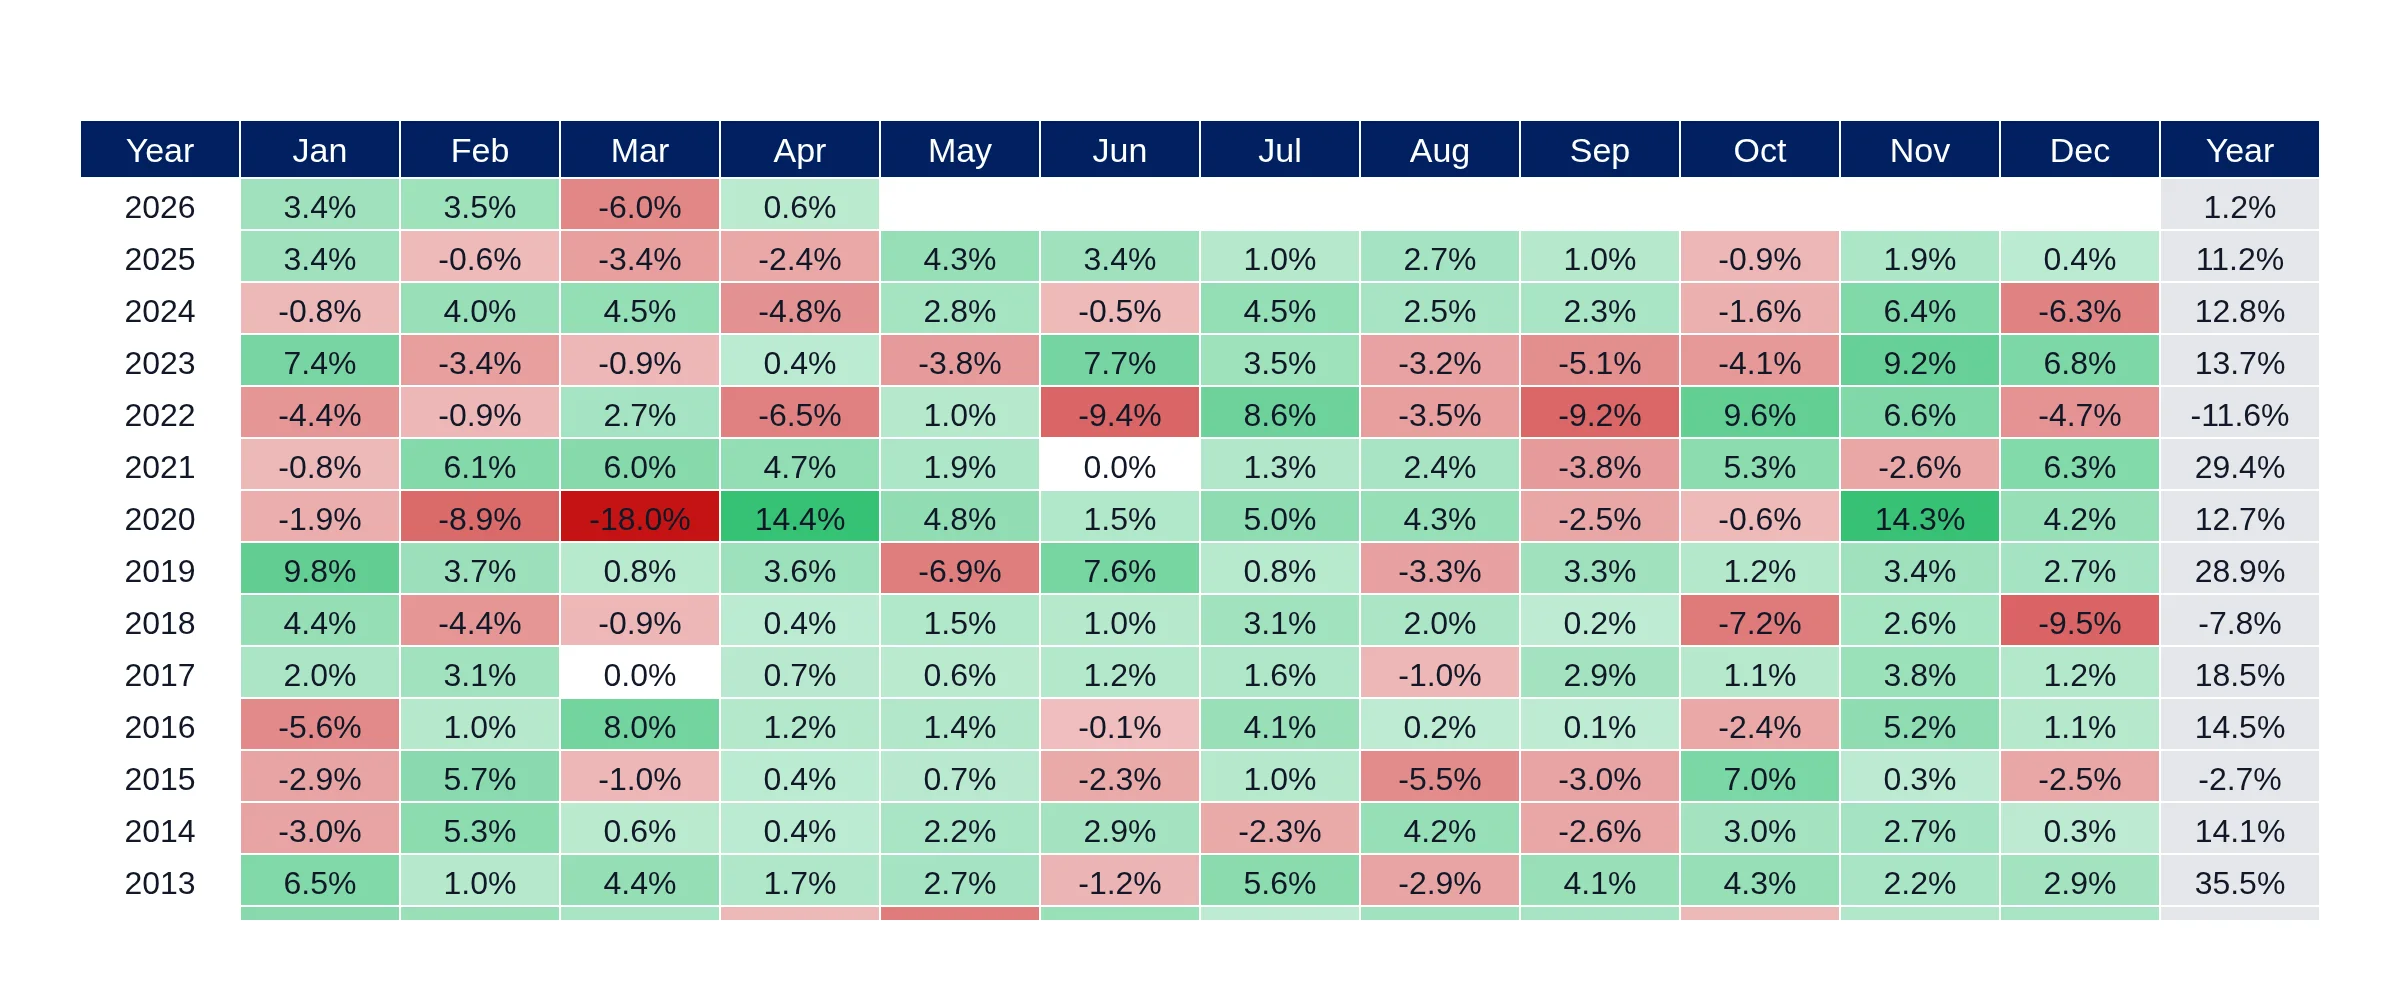
Interactive performance, drawdown, and return comparison for S&P Equal Weight, S&P 500.
The S&P 500 vs S&P 500 Equal Weight dashboard provides an interactive comparison of performance metrics, allowing users to evaluate how the S&P Equal Weight index performs against the standard S&P 500. By normalizing performance data, investors can identify trends and relative strengths over various time periods.
The Drawdown Comparison chart in the S&P 500 vs S&P 500 Equal Weight dashboard highlights the maximum drawdowns experienced by both indices, enabling investors to assess risk exposure. Understanding these drawdowns is crucial for making informed investment decisions, especially during market volatility.
The Monthly Returns Comparison chart showcases the return patterns of the S&P 500 and S&P 500 Equal Weight indices, allowing users to analyze their performance on a month-by-month basis. This detailed breakdown helps investors identify seasonal trends and the impact of market conditions on each index's returns.
This dashboard compares S&P Equal Weight, S&P 500 using internal Macrosights macroeconomic Timeseries data. The charts normalize performance, compare drawdowns, and summarize recent return patterns so users can evaluate relative market behavior across time. Data is processed with the existing Macrosights PyFinLib and PlotsLib dashboard workflow.