Compare S&P 500 total-return strategies targeting annualized volatility from 5% to 30%.
The S&P 500 volatility targeting strategy adjusts exposure to the S&P 500 Total Return Index by estimating volatility using an exponentially weighted moving average (EWMA) with a lambda parameter of 0.95. This method allows the strategy to dynamically scale exposure to meet target annualized volatility levels ranging from 5% to 30%.
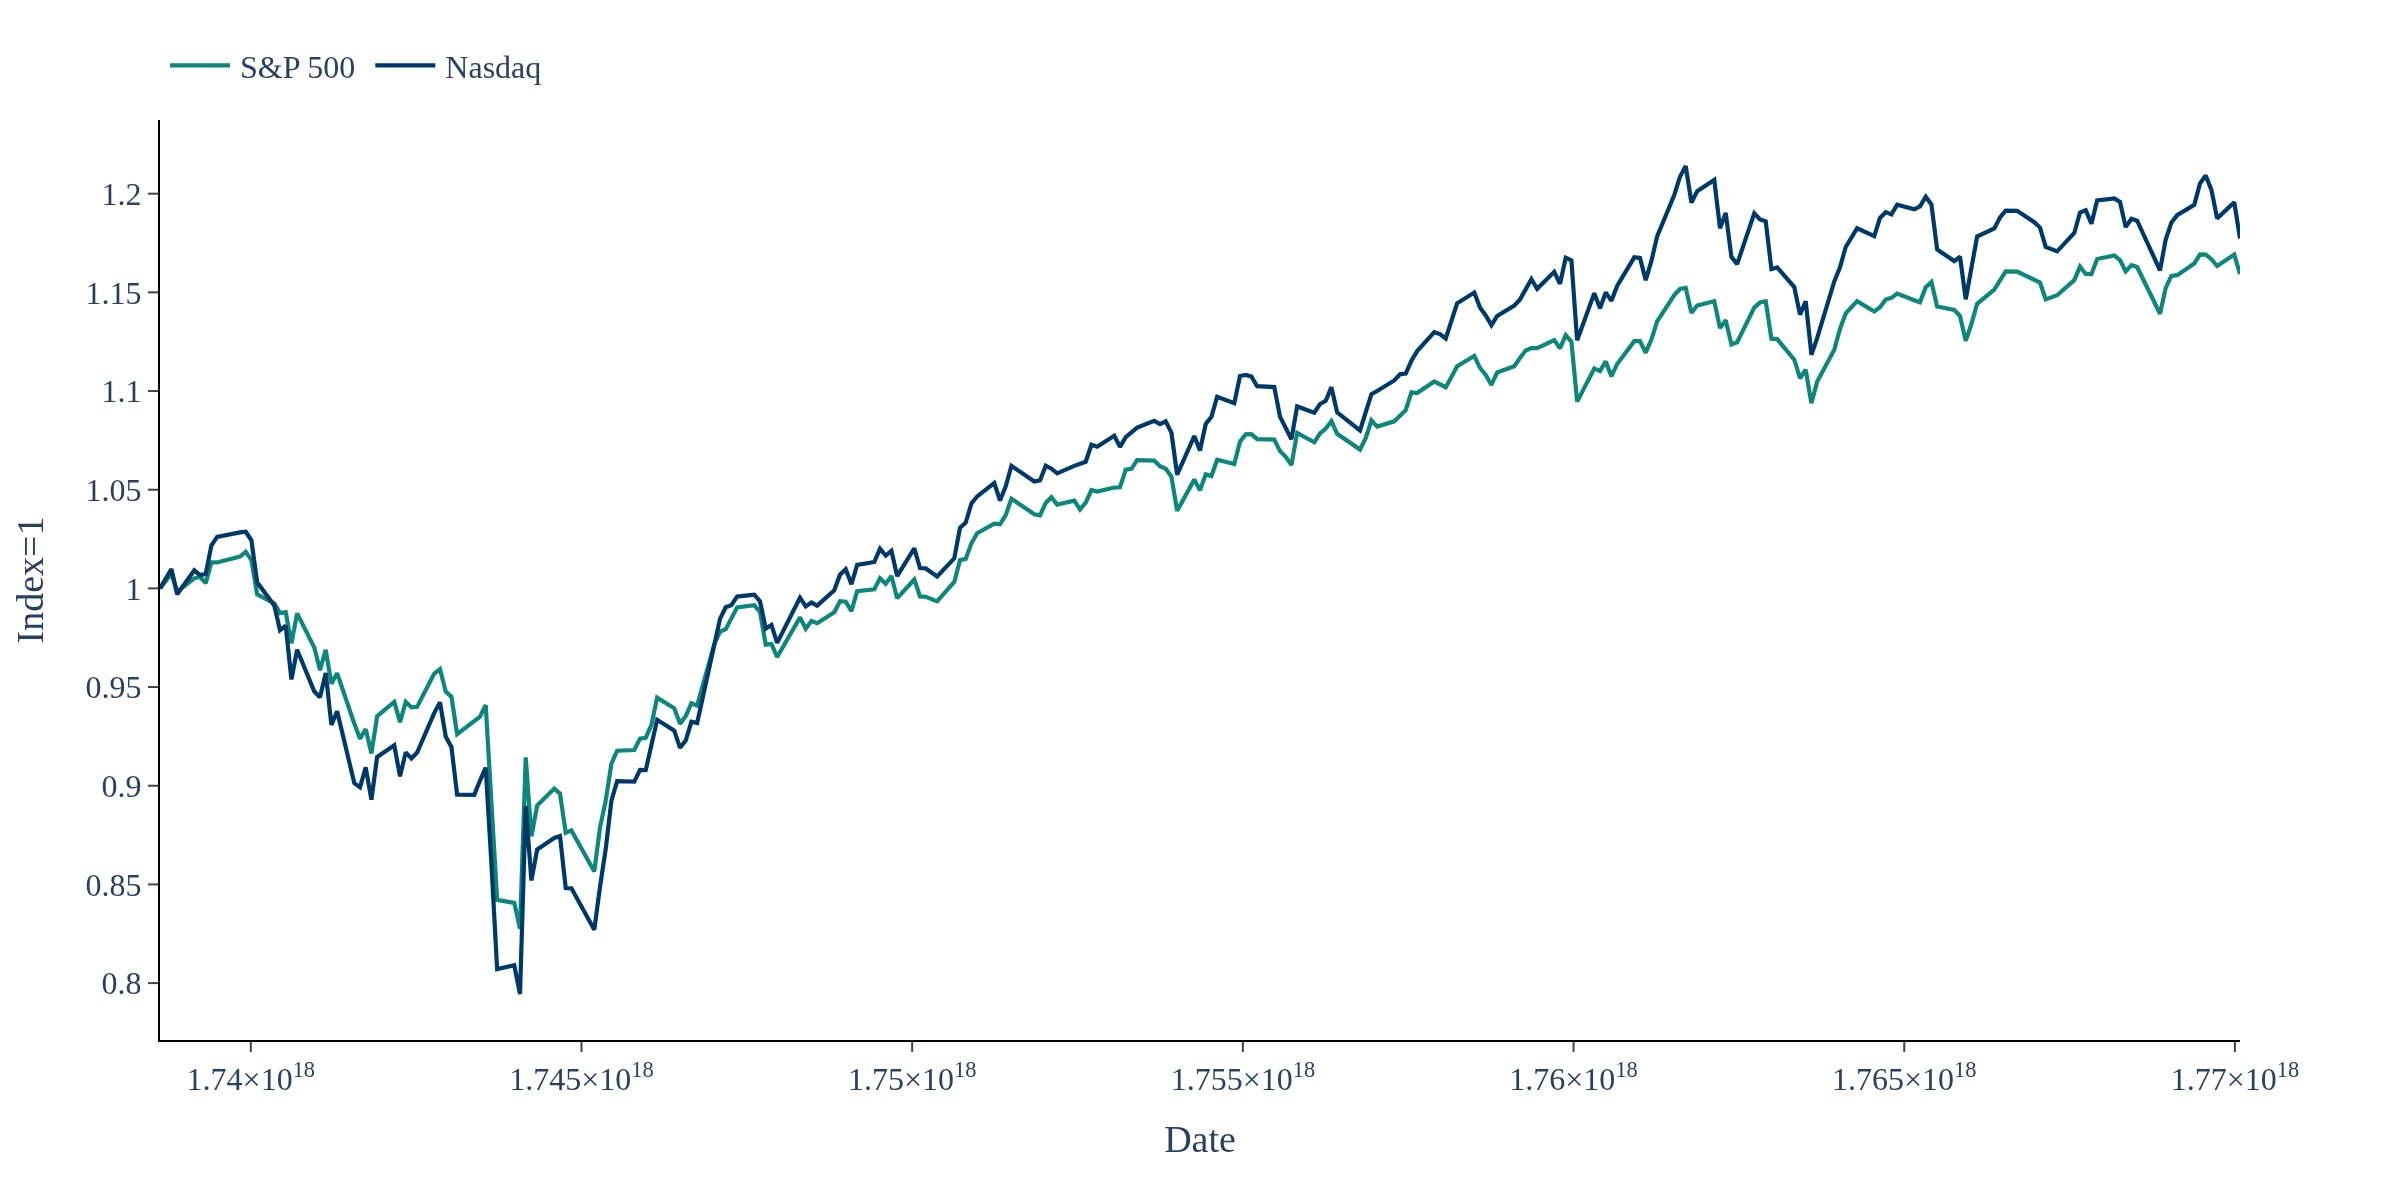
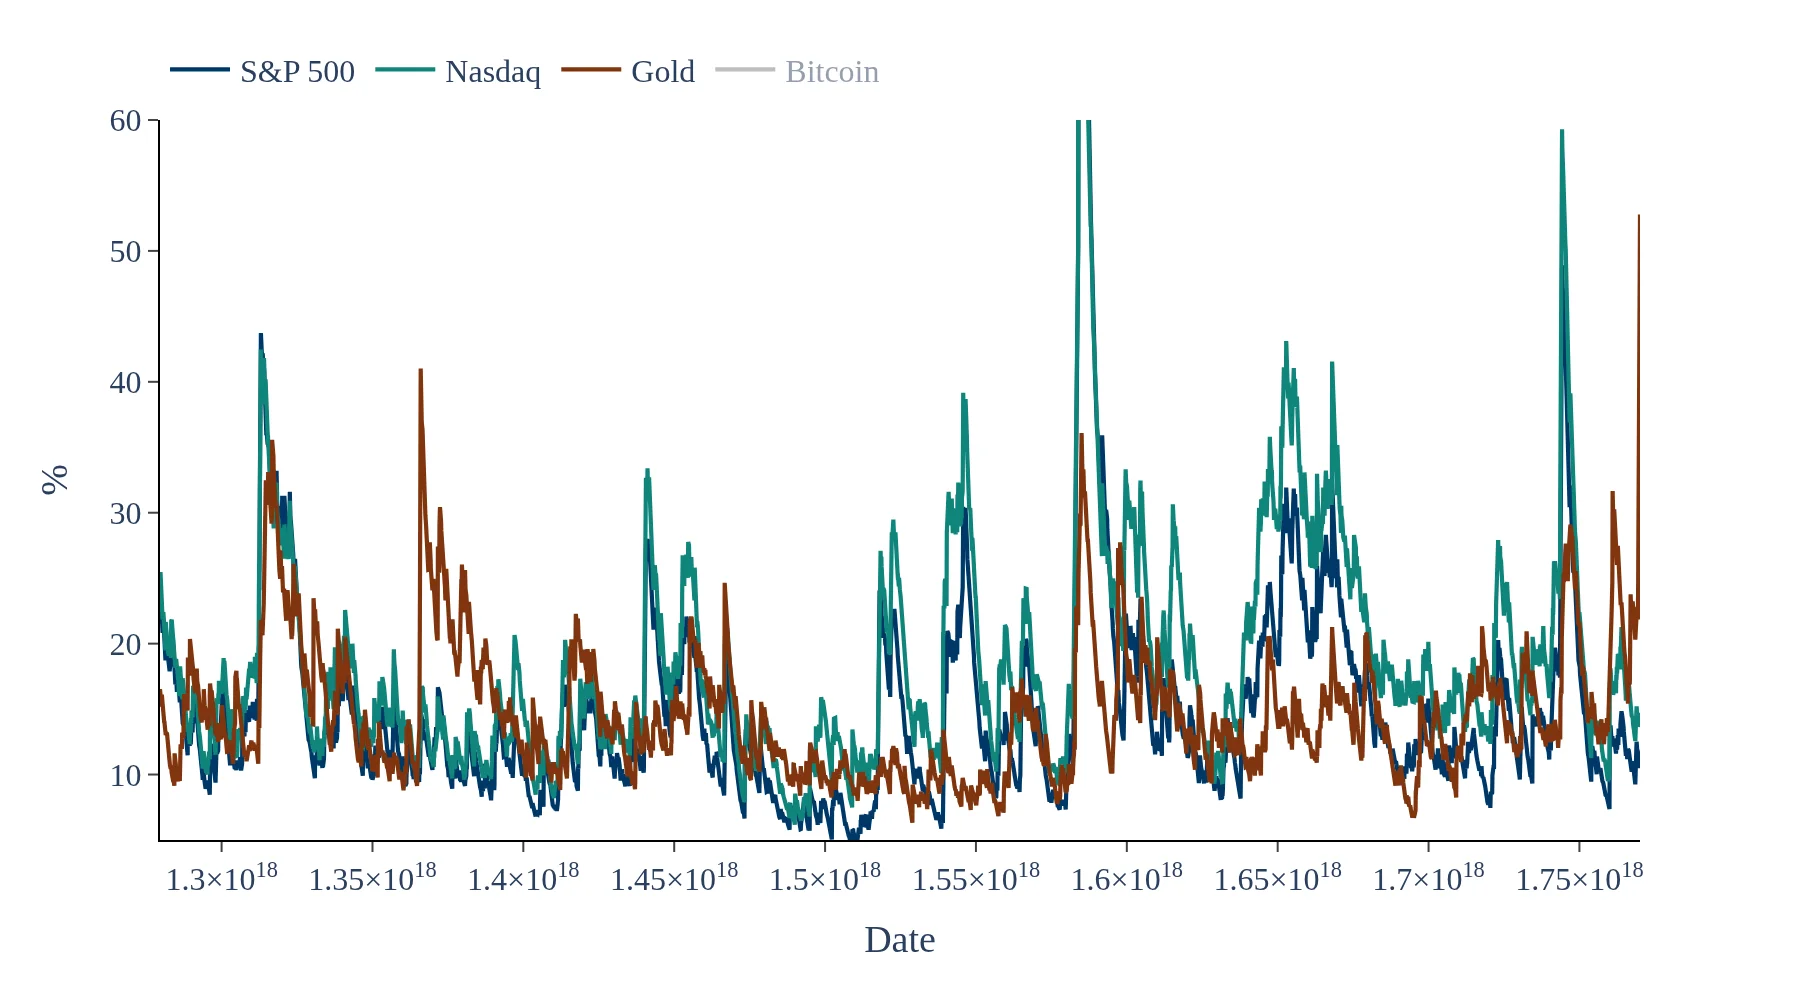
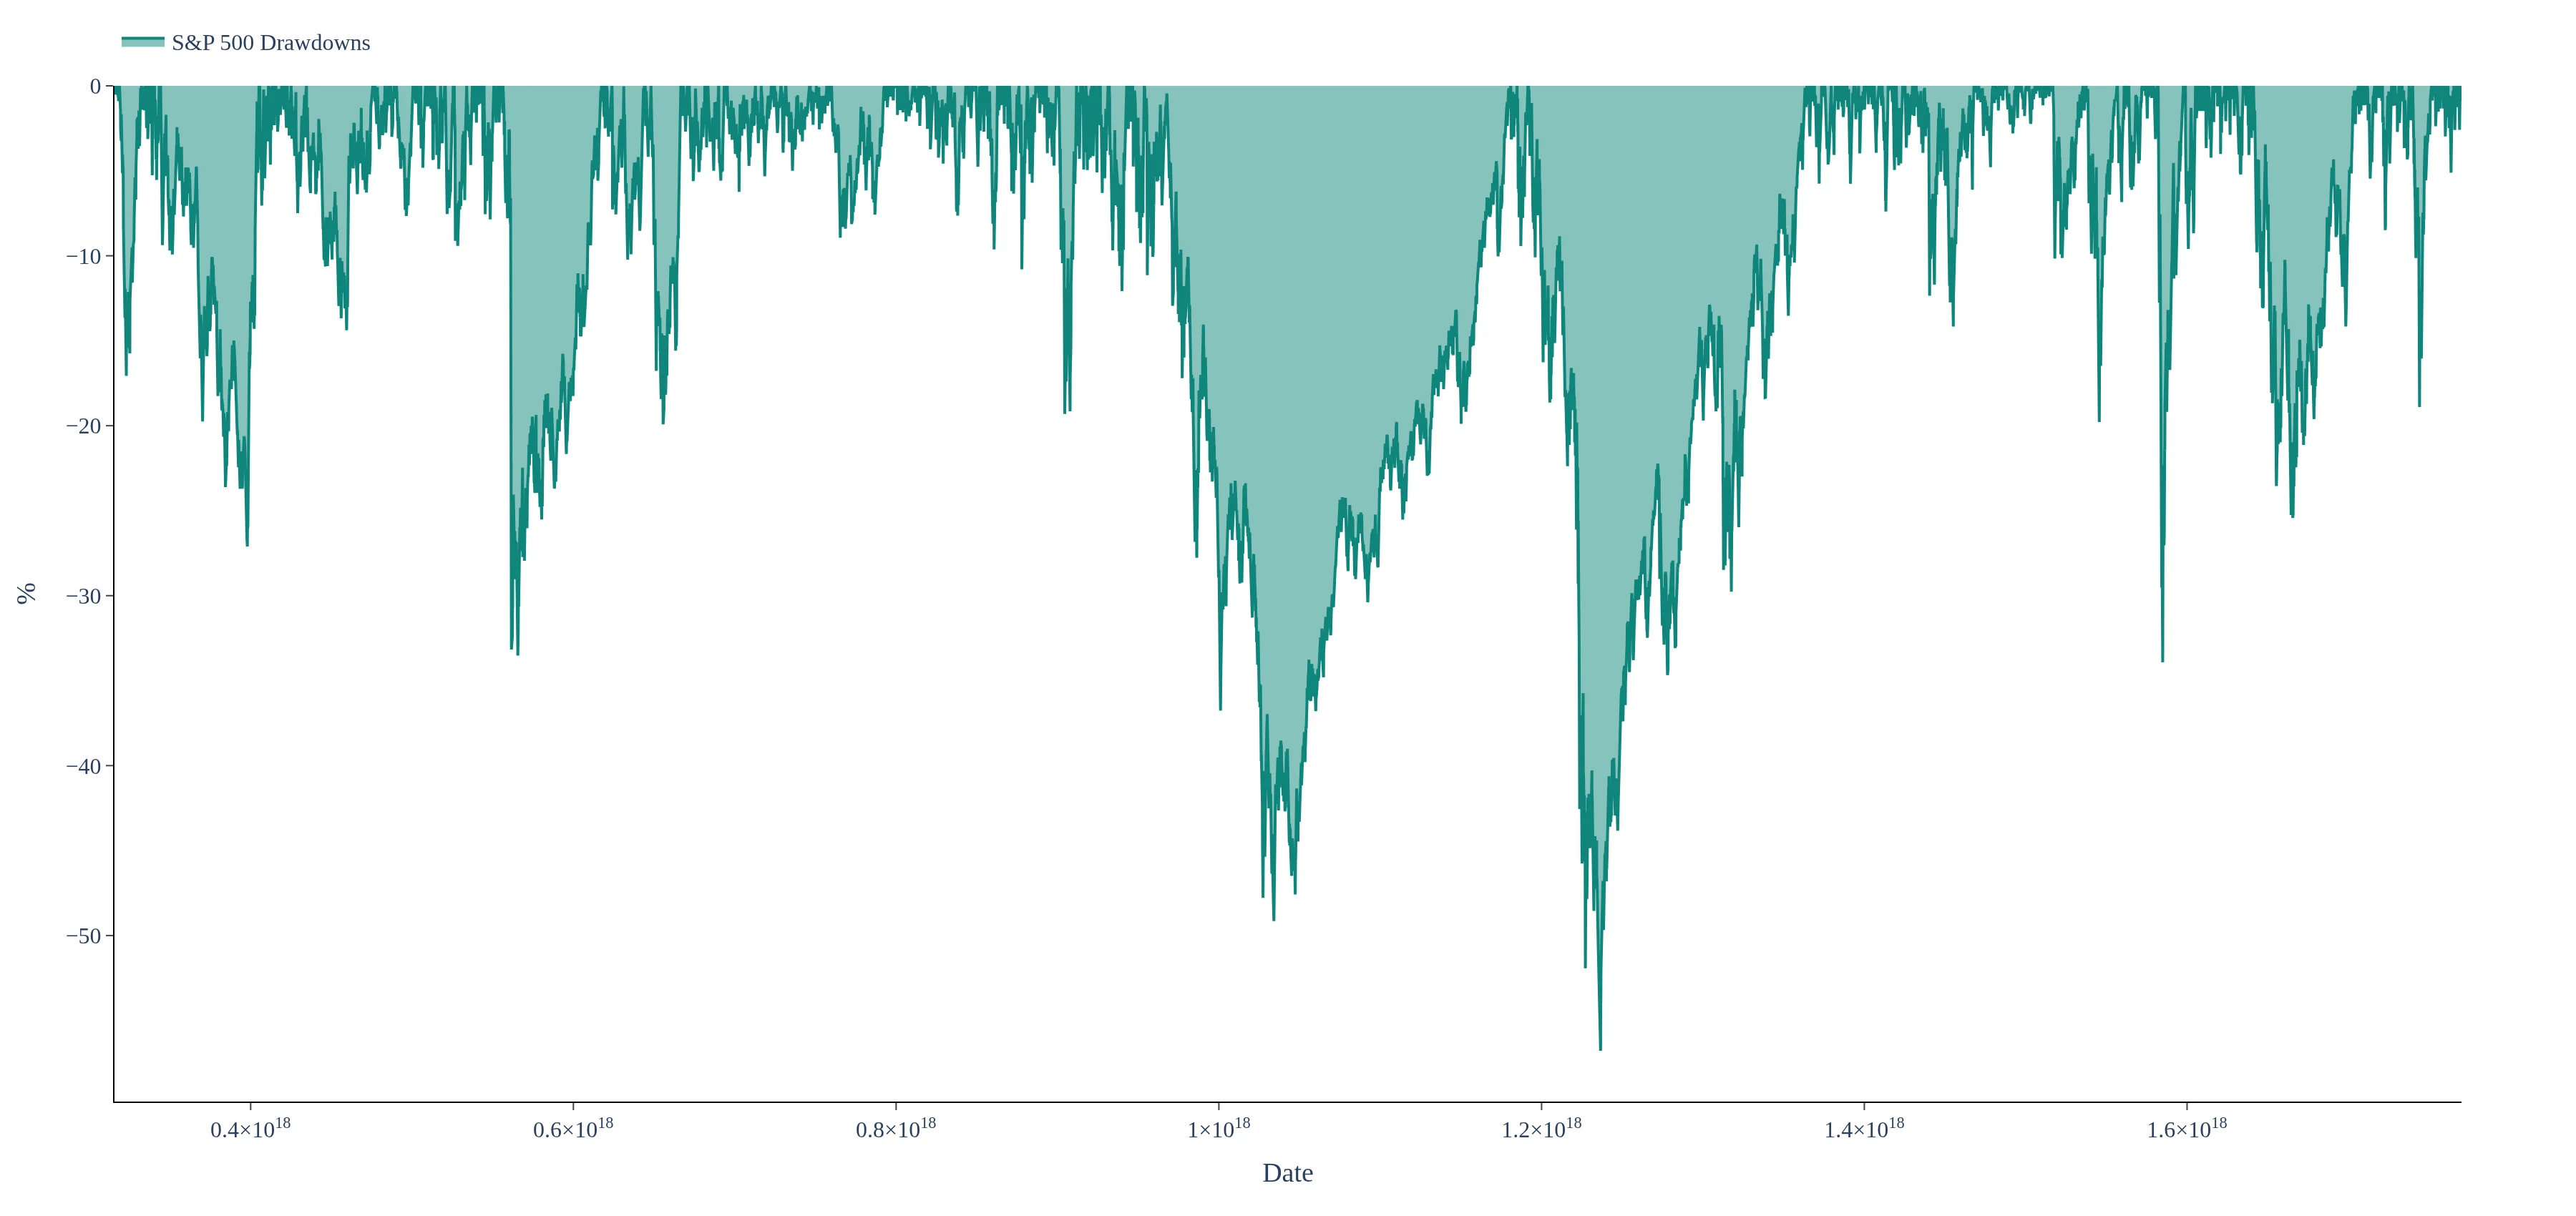
The performance of S&P 500 volatility targeting backtests is evaluated using normalized performance series, rolling 252-day annualized volatility, and drawdowns. Drawdowns measure the percentage decline from each strategy's previous peak, providing insights into risk and performance during different market conditions.
The S&P 500 volatility targeting backtests are hypothetical and do not account for every implementation constraint, such as transaction costs, taxes, or financing considerations. As a result, actual performance may differ significantly from the backtested results presented in the dashboard.
These backtests adjust exposure to the S&P 500 Total Return Index according to its estimated volatility. The volatility estimate is an exponentially weighted moving average (EWMA) of S&P 500 returns using a lambda parameter of 0.95, which gives more weight to recent observations. Strategy exposure is scaled to target annualized volatility levels of 5%, 10%, 15%, 20%, 25% and 30%. Performance series are normalized to one for comparison; the realized-volatility panel uses a rolling 252-trading-day annualized standard deviation, and drawdowns measure each series' percentage decline from its previous peak. Leverage costs are assumed to be the US T-Bill return plus 1% per year. Results are hypothetical backtests and do not include every implementation constraint, transaction cost, tax or other financing consideration.