Monitor real time us stocks and bonds (treasuries) correlations.
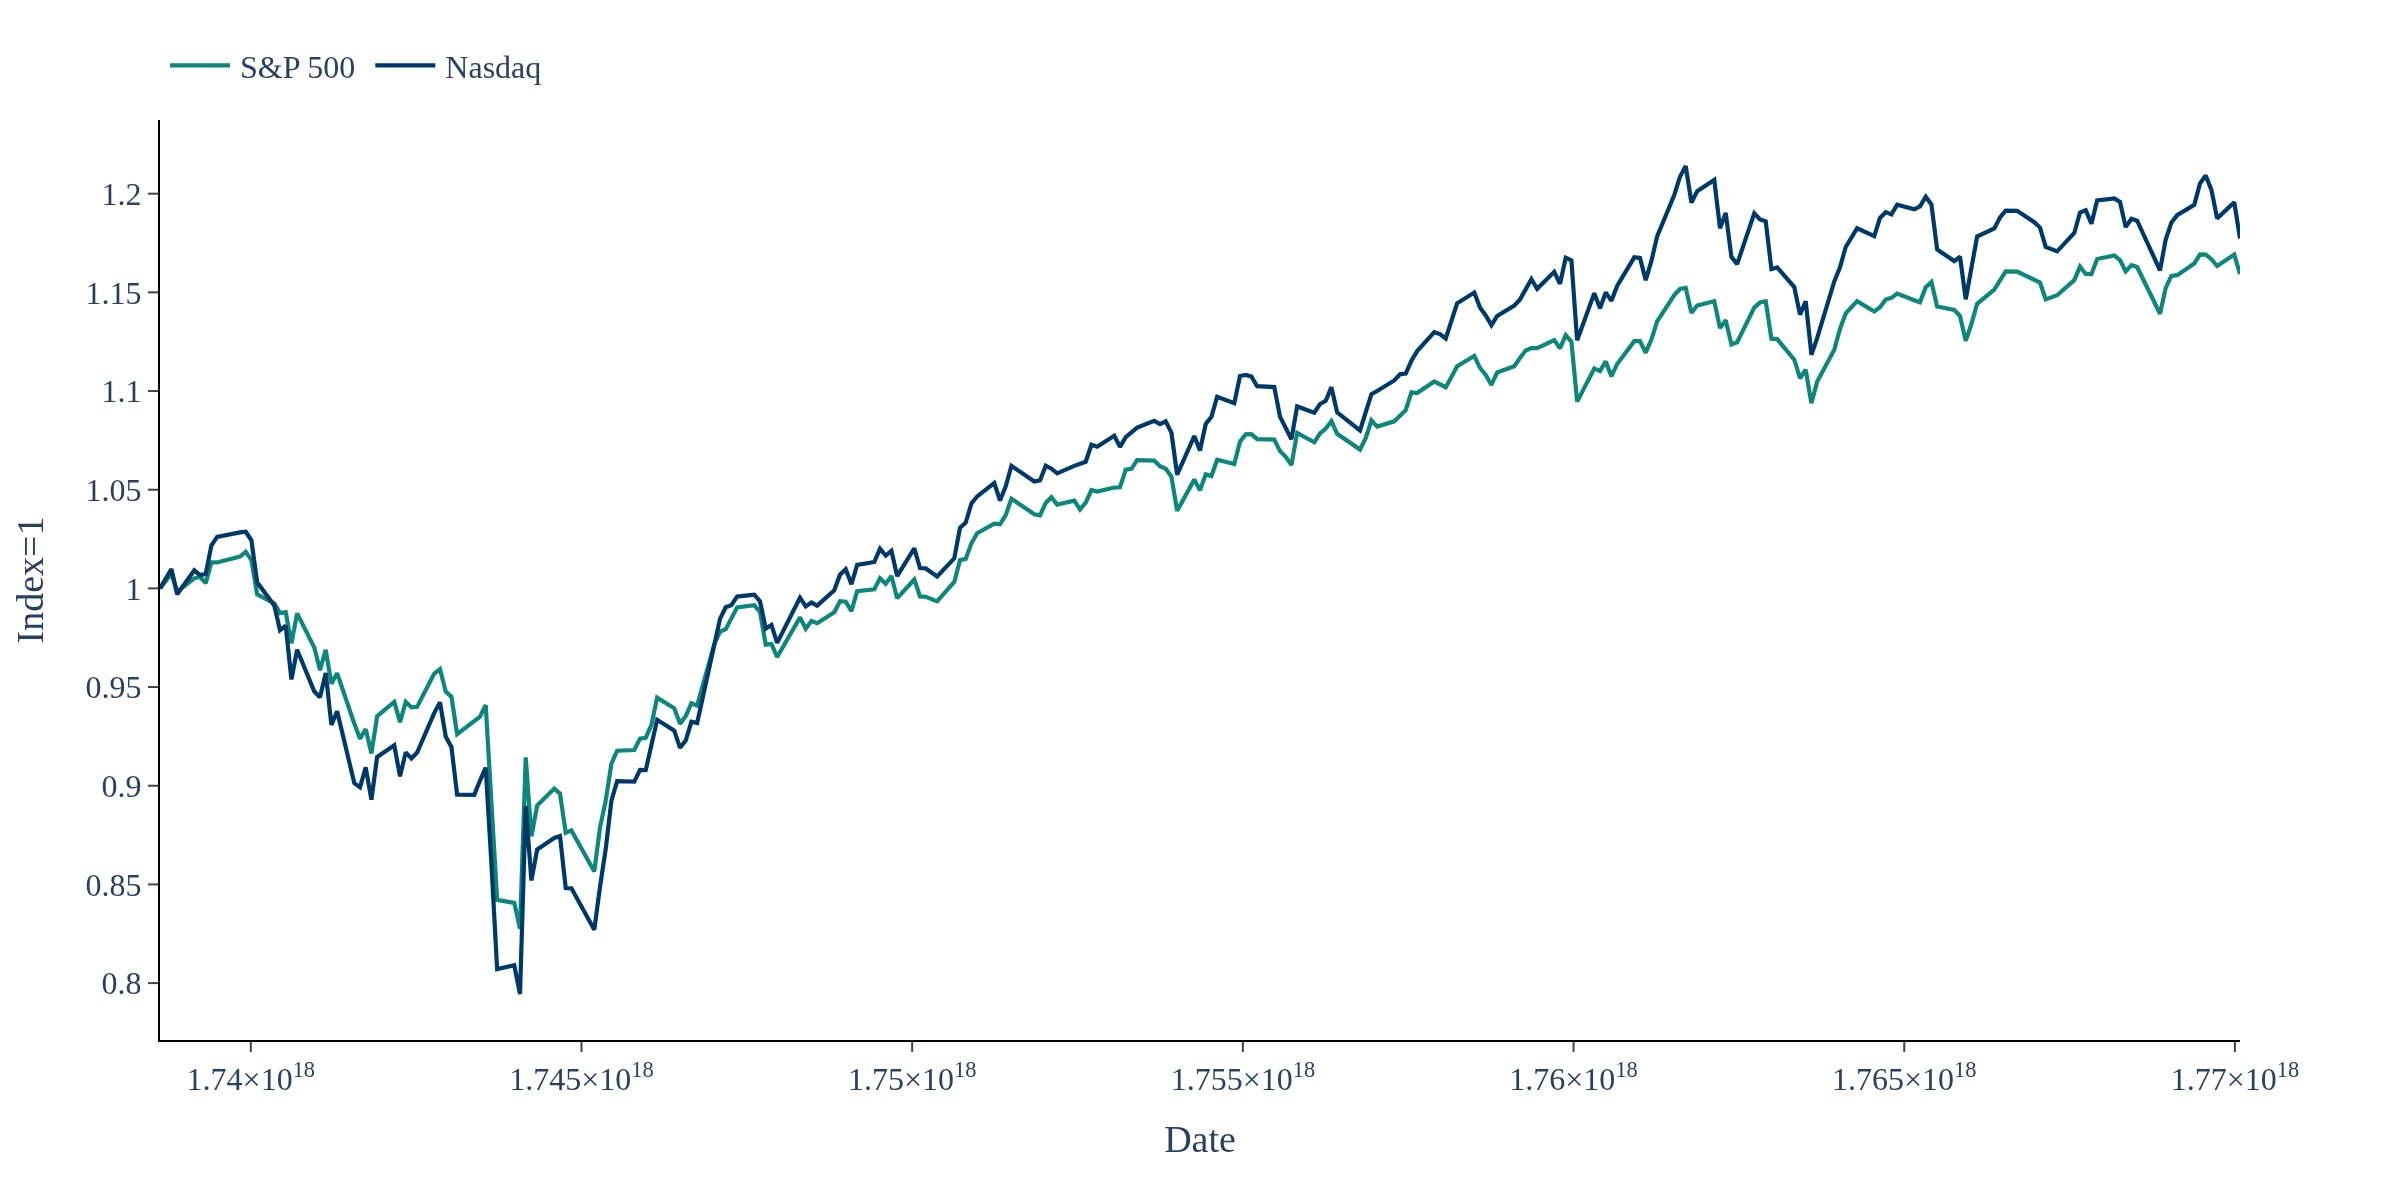
The US Stocks and Bonds Correlation Monitor provides insights into the correlation between the S&P 500 and US Treasury bonds, allowing investors to assess market risk dynamically. By analyzing rolling correlations over various lookback periods, users can identify shifts in the stock-bond relationship that may indicate changing macroeconomic conditions.
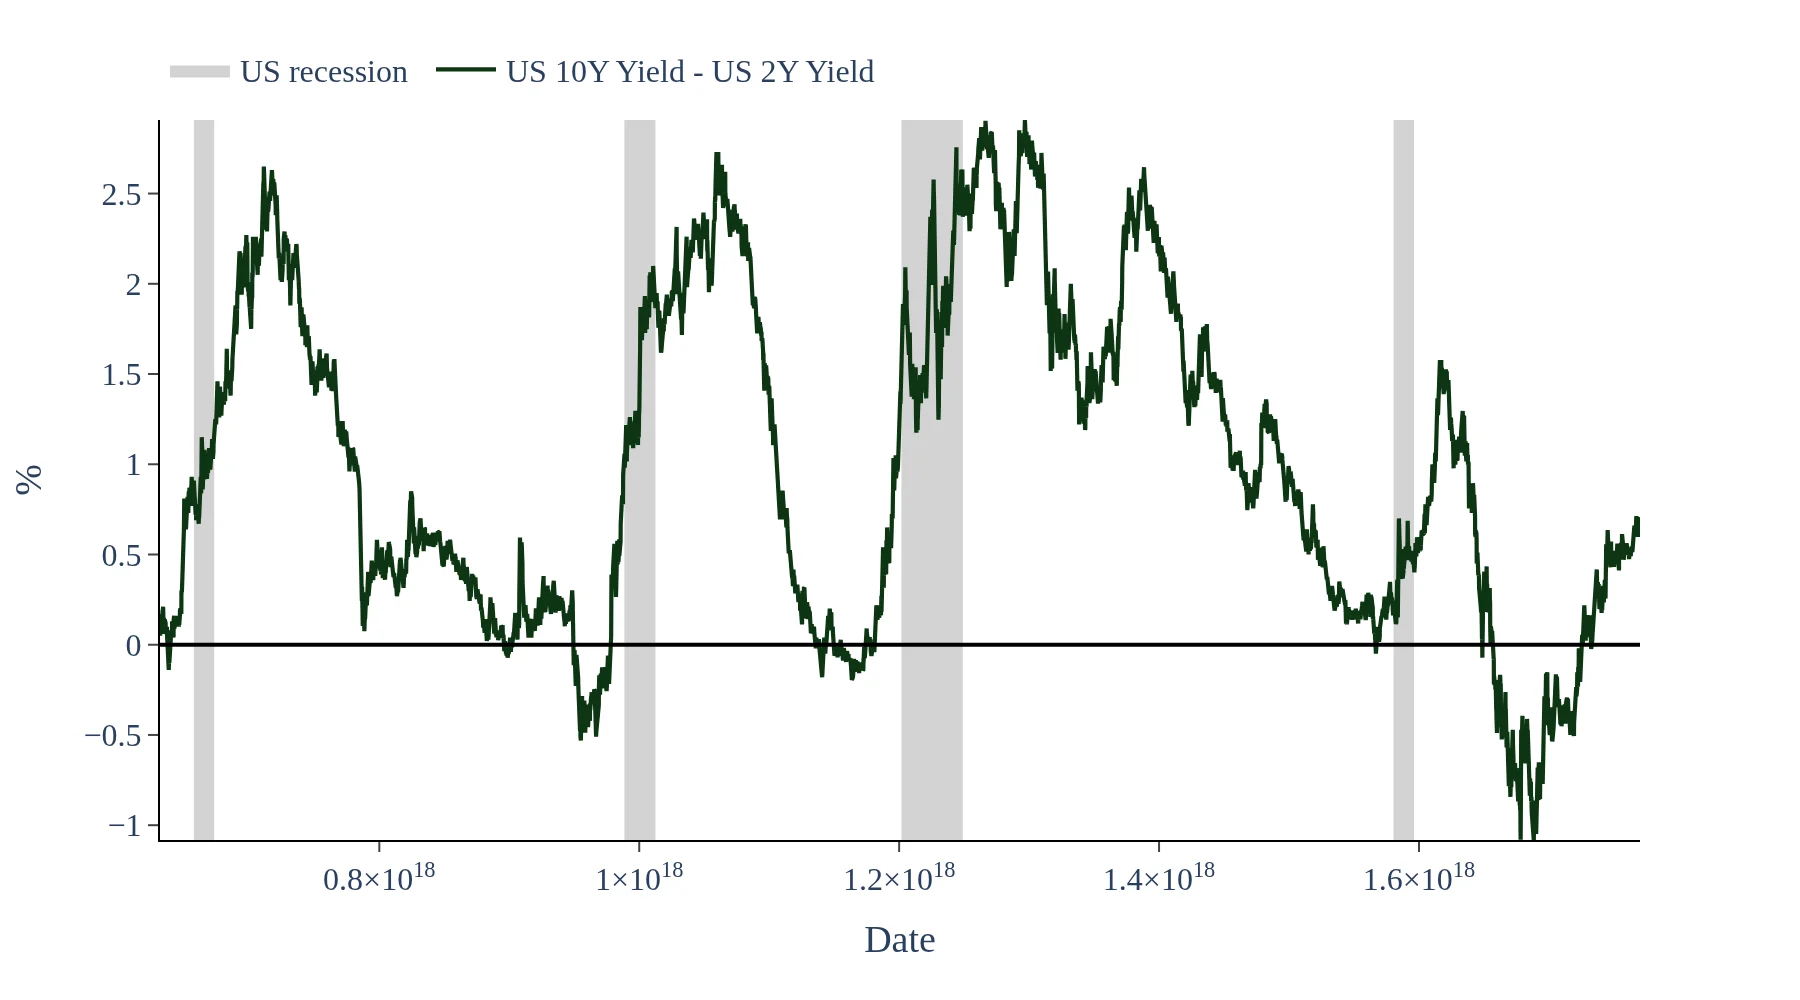
Recession shading in the US Stocks and Bonds Correlation Monitor offers crucial context for understanding how stock-bond correlations change during different phases of the business cycle. This feature helps investors identify potential risks and opportunities during economic downturns, enhancing their ability to make informed investment decisions.
The correlation data in the US Stocks and Bonds Correlation Monitor is updated on trading days, ensuring that users have access to the most current information. This real-time data allows traders and analysts to track diversification dynamics and hedging effectiveness as market conditions evolve.
This dashboard monitors the correlation between US stocks and US Treasury bonds using daily return data for the S&P 500 and benchmark Treasury yields/prices. It computes rolling correlations over multiple lookback windows to show how the stock–bond relationship changes across market regimes. Recession shading is included to provide business-cycle context for correlation shifts. Data is updated on trading days and displayed in a standardized format for easy comparison through time. Use it to track diversification dynamics, hedging effectiveness and changes in macro risk conditions.