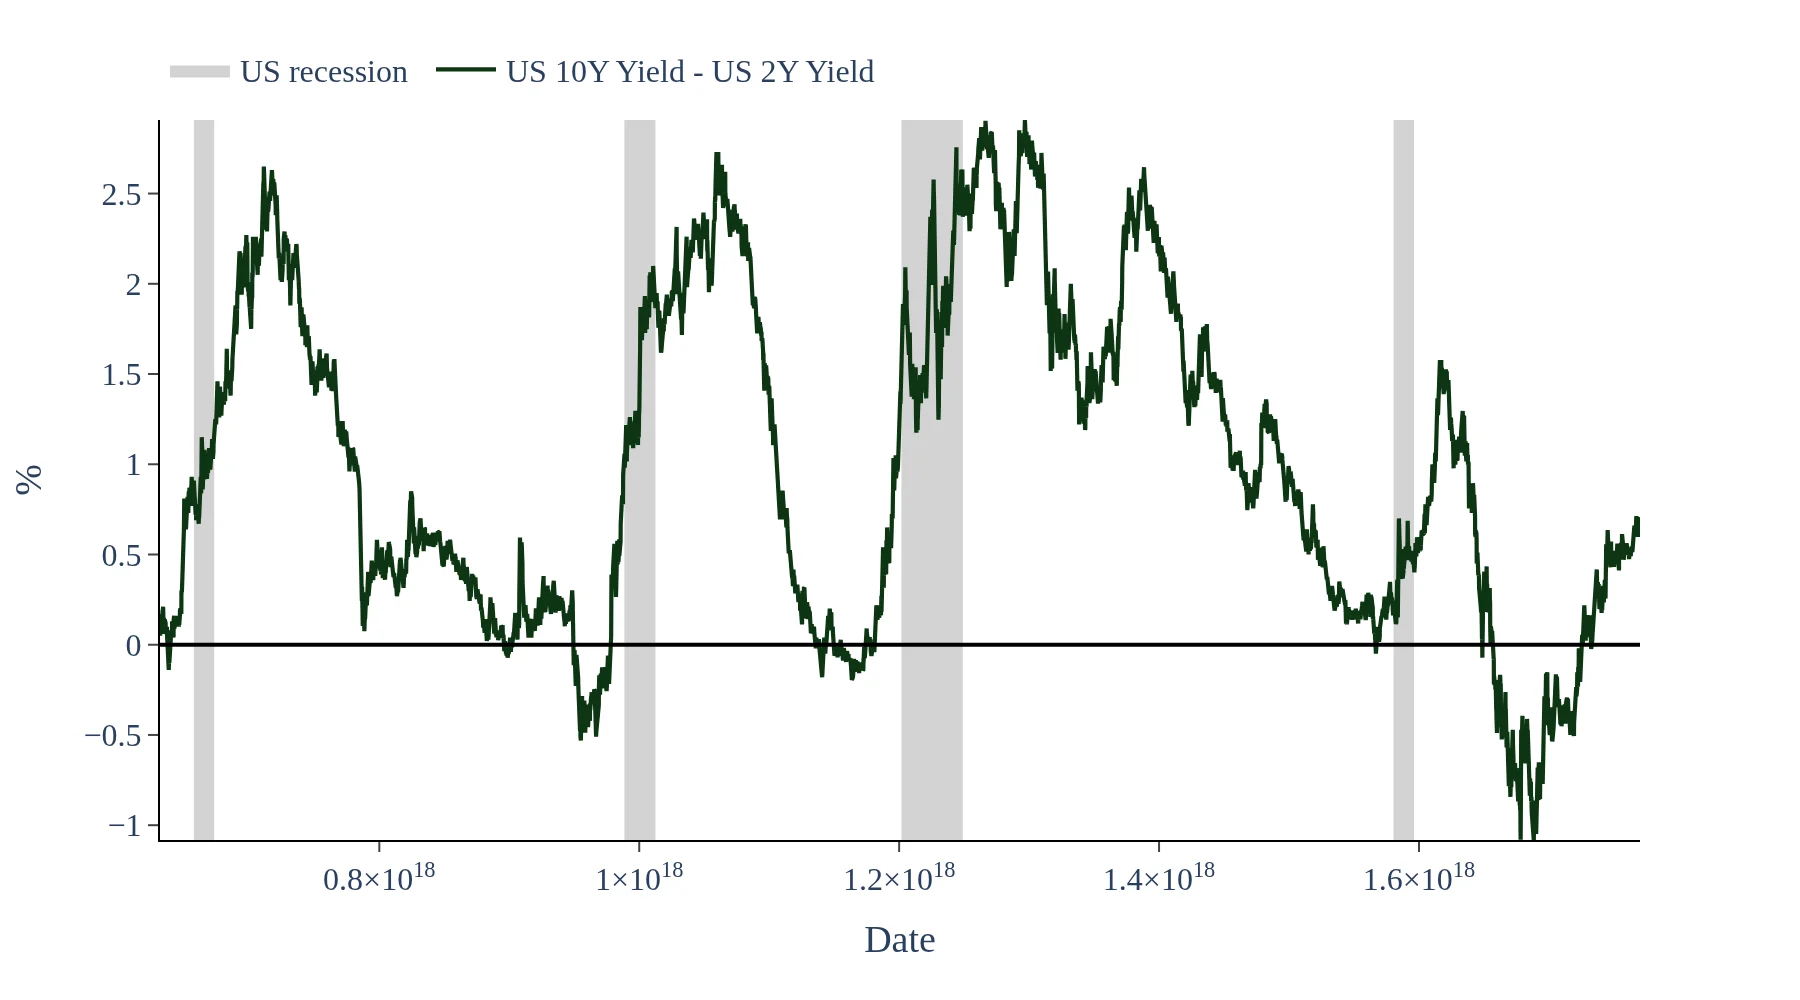
The US Treasuries All Maturities Screen allows you to analyze yield curve changes by visualizing yields across various maturities. You can identify periods of yield curve steepening or inversion, which are critical for understanding market reactions to economic indicators like inflation and Federal Reserve policy shifts.
Monitoring the term structure of Treasury interest rates through this dashboard provides insights into how different maturities respond to economic conditions. It helps investors assess the impact of growth, inflation, and monetary policy on yields, enabling informed investment decisions.
The US Treasuries All Maturities Screen updates its yield data with new market observations regularly, ensuring that you have access to the most current information. This timely data is essential for macroeconomic analysis and understanding interest rate trends.
This dashboard tracks US Treasury yields across all major maturities using official market data to visualize how interest rates evolve over time. It shows the yield for multiple tenors (from short-term bills to long-term bonds) to highlight changes in level, curve shape and rate volatility across cycles. The charts help identify periods of yield curve steepening or inversion and compare how different maturities react to growth, inflation and Fed policy shifts. Data is updated with new yield observations and presented in a clear, historical format for macro and rates analysis. Use it to monitor the full US yield curve and understand the term structure of Treasury interest rates.